Blog
All Blog Posts | Next Post | Previous Post

 TMS FNC Chart 4.0
Tuesday, February 24, 2026
TMS FNC Chart 4.0
Intro
We are excited to announce TMS FNC Chart 4.0! This release brings a more flexible layout model and smarter label handling while keeping the familiar TMS FNC Chart API intact. It is a focused update aimed at making charts easier to read, easier to style, and easier to fit into modern UI layouts.
What's New in 4.0
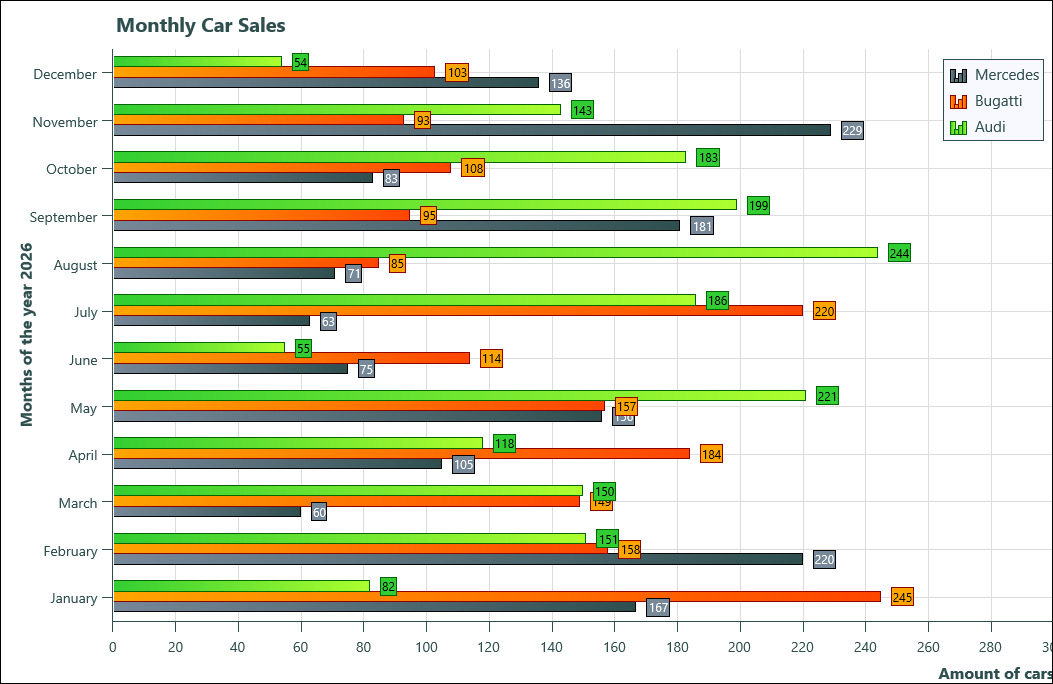
Horizontal mode: render charts with a horizontal orientation using the new
Orientationproperty.Smart Labels: improved label behavior for
XValuesandYValuesto keep axis labels clearer and more readable.
Using Horizontal Orientation
Switching between vertical and horizontal layouts is a single property change. Use TTMSFNCChartOrientation with values coVertical (default) and coHorizontal.
TMSFNCChart1.Orientation := coHorizontal; // Switch to horizontal layout
To restore the classic layout:
TMSFNCChart1.Orientation := coVertical; // Default vertical layout
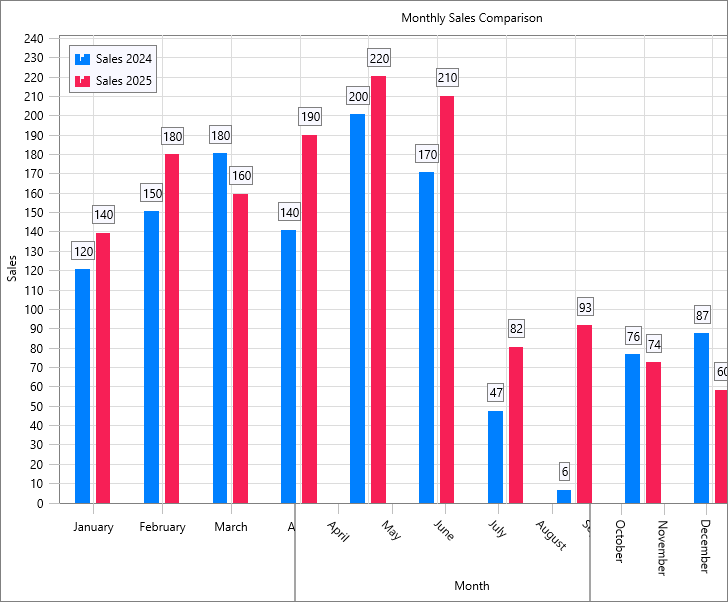
Smart Labels in Action
Smart Labels give you better control over how axis labels are spaced and rotated. You can enable the behavior per series and fine tune label density with MinLabelSpacing, MinLabels, and MaxLabels. When AutoRotate is enabled, labels can rotate automatically to avoid collisions.
with TMSFNCChart1.Series[0].XValues.SmartLabels do
begin
  Enabled := True;
  AutoRotate := True;
  MinLabelSpacing := 8;
  MinLabels := 3;
  MaxLabels := 10;
end;
You can apply the same configuration to the Y axis when needed:
with TMSFNCChart1.Series[0].YValues.SmartLabels do
begin
  Enabled := True;
  AutoRotate := True;
  MinLabelSpacing := 6;
  MinLabels := 3;
  MaxLabels := 8;
end;
Mockup XValues of three different chart images with different widths
What's Next
Keep an eye out for an upcoming blog & video series dedicated to TMS FNC Chart. We will cover new features, practical tips, and best practices for building modern charting experiences across platforms. TMS FNC Chart 4.0 is all about flexibility and clarity. Horizontal mode opens up new layout options, and Smart Labels help keep charts clean and readable.
Pieter Scheldeman
Related Blog Posts
-
TMS FNC Chart 4.0
-
The Next Evolution of Charting in Delphi: Getting Started
-
The Next Evolution of Charting in Delphi: Data Import & Export
-
The Next Evolution of Charting in Delphi: Look & Feel
-
The Next Evolution of Charting in Delphi: Data Binding
-
The Next Evolution of Charting in Delphi: Multipoint Series

This blog post has not received any comments yet.
All Blog Posts | Next Post | Previous Post