Blog
All Blog Posts | Next Post | Previous Post

 The Next Evolution of Charting in Delphi: Multipoint Series
Friday, April 3, 2026
Intro
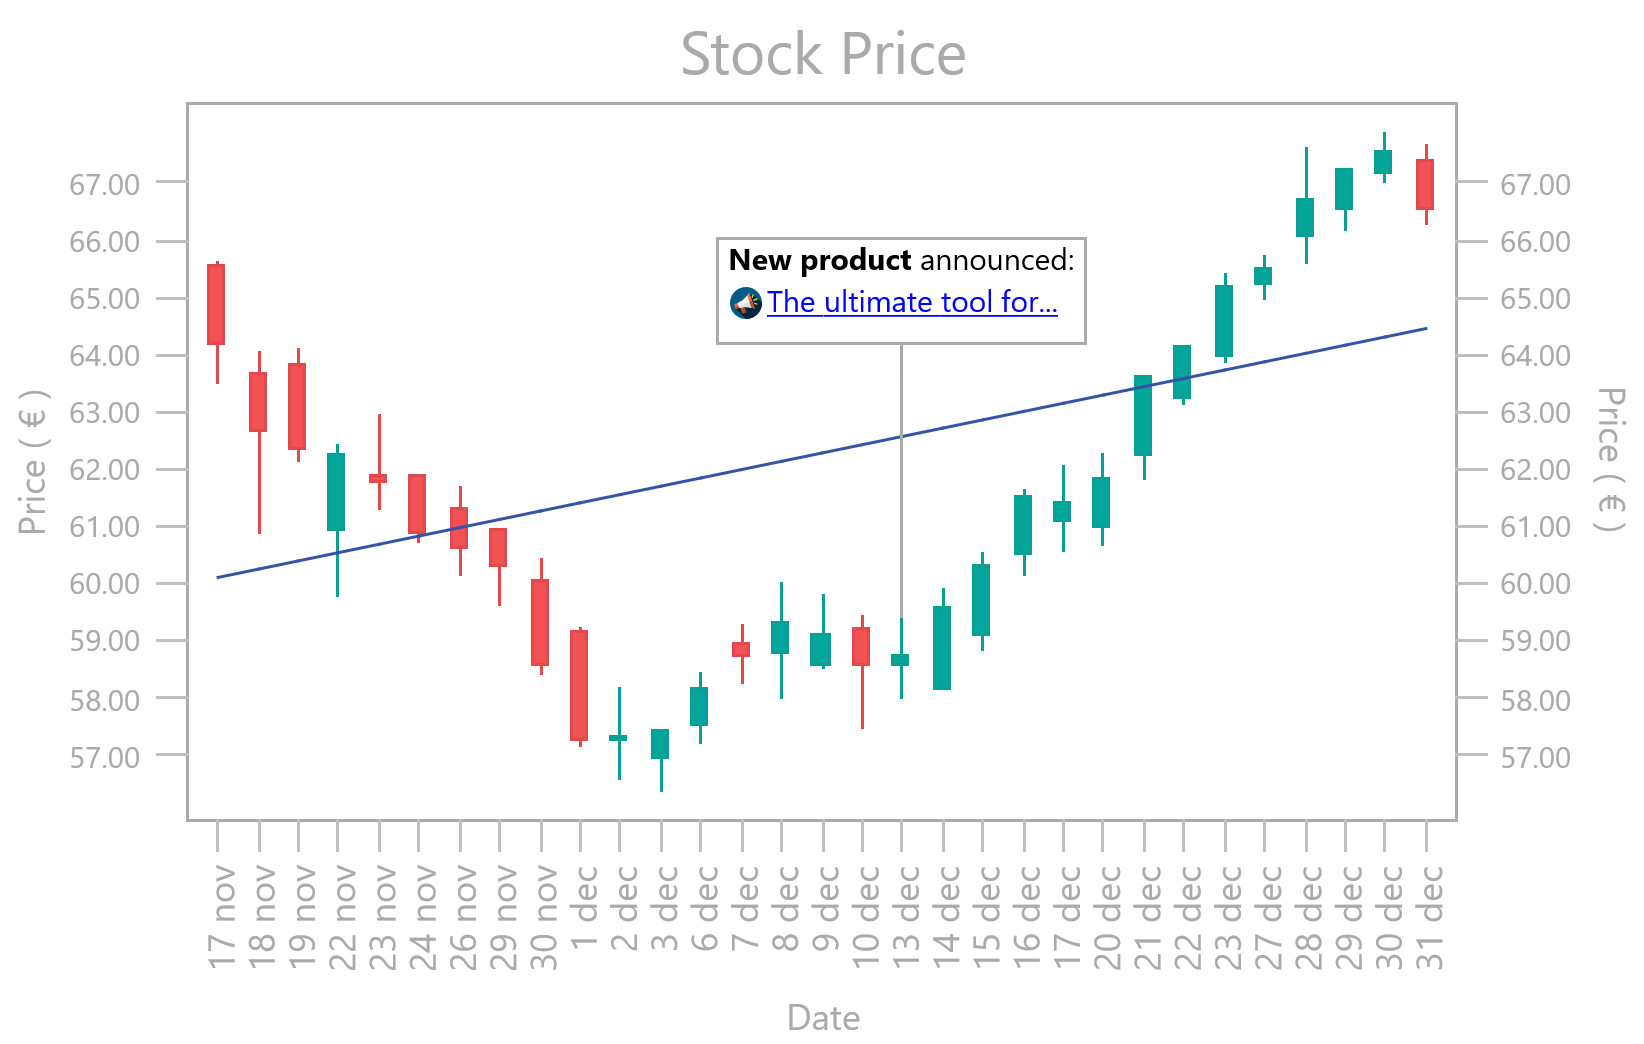
Stock data is one of the most demanding chart scenarios: dense OHLC bars, date labels that need rotating, interactive panning across months of history, and overlay series like trend lines and moving averages sitting on top. This post shows how TMS FNC Chart handles all of it with a real NVIDIA price history dataset — loading straight from CSV, switching between OHLC and line views, and adding a trend line and 30-day moving average in a few lines of code.
Watch The Video
Watch the companion walkthrough on YouTube:
Quick Highlights
LoadFromCSVMultiPointData maps CSV columns to Open, High, Low, and Close in a single call — no manual parsing.
LoadFromCSVData pulls just the Close column for the line view, and
AddTrendLine/AddMovingAverageadd overlays over the same data immediately after.Horizontal panning and zoom are enabled with three properties, and a point-based crosshair snaps to the nearest bar automatically.
The
BeforeDrawSerieXValueevent suppresses out-of-range date labels that appear when the scroll window extends past the data.
Loading OHLC Data from CSV
The CSV has five columns: Date, Open, High, Low, Close. LoadFromCSVMultiPointData takes the file path, a load options object, and then the column index for each OHLC field followed by the label column. Setting CSVFirstLine := cflFirstLineSkip discards the header row automatically.
lo := TTMSFNCChartLoadOptions.Create;
lo.CSVDelimiter := ',';
lo.CSVFirstLine := cflFirstLineSkip;

TMSFNCChart1.LoadFromCSVMultiPointData(STOCKDATAFILE, lo,
  2,   // Open
  3,   // High
  1,   // Low
  4,   // Close
  -1, -1,
  0);  // Label (Date)

TMSFNCChart1.Series[0].ChartType := ctOHLC;
After the load, setting ChartType := ctOHLC is the only change needed to render the bars. The same call works for ctCandleStick if you prefer filled bodies.
Interaction: Panning and Zoom
Six months of daily bars is too much to read at full width. Three properties turn on horizontal-only scaling and panning, and MinX / MaxX set the initial visible window to the full dataset so the scroll range is correct from the start.
TMSFNCChart1.Interaction := True;
TMSFNCChart1.InteractionOptions.ScaleMode := smHorizontal;
TMSFNCChart1.InteractionOptions.Panning   := True;

TMSFNCChart1.Series[0].AutoXRange := arDisabled;
TMSFNCChart1.Series[0].MinX := 0;
TMSFNCChart1.Series[0].MaxX := TMSFNCChart1.Series[0].Points.Count - 1;
A point-based crosshair snaps to the nearest bar on hover, showing the exact OHLC values without the crosshair drifting between bars.
TMSFNCChart1.Crosshair.Visible := True;
TMSFNCChart1.Crosshair.Modes   := [ccmPointBased];
Highlight: smHorizontal locks vertical scale while panning, which is exactly what you want for stock charts — the Y axis stays fixed to the full price range while you scroll through time.
Line View: Trend Line and Moving Average
The second button reloads the same CSV using LoadFromCSVData, pulling only the Close column. AddTrendLine and AddMovingAverage are then called over the full point range and each returns a TTMSFNCChartSerie that can be styled like any other series.
TMSFNCChart1.LoadFromCSVData(STOCKDATAFILE, lo, [4], -1, 0);

TMSFNCChart1.AddTrendLine(0, 0, TMSFNCChart1.Series[0].Points.Count - 1);
TMSFNCChart1.AddMovingAverage(0, 0, TMSFNCChart1.Series[0].Points.Count - 1, 30);

TMSFNCChart1.Series[1].Stroke.Color := gcRed;
TMSFNCChart1.Series[1].Stroke.Width := 3;

TMSFNCChart1.Series[2].Stroke.Color := gcBlue;
TMSFNCChart1.Series[2].Stroke.Width := 3;
The trend line (series index 1) is drawn in red, and the 30-day moving average (series index 2) in blue. Both get AutoXRange := arDisabled and matching MinX / MaxX so they align correctly with the price series during pan and zoom.
Highlight: AddTrendLine and AddMovingAverage append new series to the chart and return them directly. No separate component, no manual calculation — just style the result and move on.
Suppressing Out-of-Range X Labels
When AutoXRange is disabled and the chart draws axis labels beyond the data range, labels with invalid indices appear. The BeforeDrawSerieXValue event catches them before they render.
procedure TForm1.TMSFNCChart1BeforeDrawSerieXValue(Sender: TObject;
  AGraphics: TTMSFNCGraphics; ASerie: TTMSFNCChartSerie;
  APosition: TTMSFNCChartXAxisPosition;
  var ADrawValue: TTMSFNCChartDrawXYValue; var ADefaultDraw: Boolean);
begin
  if ADrawValue.Value < 0 then
    ADefaultDraw := False;

  if ADrawValue.Value >= ASerie.Points.Count then
    ADefaultDraw := False;
end;
Setting ADefaultDraw := False skips the draw for that tick entirely, leaving the axis clean at both ends of the scroll range.
Conclusion
TMS FNC Chart reduces a real-world stock charting scenario to straightforward Delphi code: one call to load OHLC data from CSV, three properties for interactive panning, and two calls to add trend and moving average overlays. The same series model and the same MinX / MaxX scroll pattern apply across both chart types, so switching between the OHLC view and the close-price line view is a matter of reloading the data rather than rebuilding the chart.
Pieter Scheldeman
Related Blog Posts
-
TMS FNC Chart 4.0
-
The Next Evolution of Charting in Delphi: Getting Started
-
The Next Evolution of Charting in Delphi: Data Import & Export
-
The Next Evolution of Charting in Delphi: Look & Feel
-
The Next Evolution of Charting in Delphi: Data Binding
-
The Next Evolution of Charting in Delphi: Multipoint Series

This blog post has not received any comments yet.
All Blog Posts | Next Post | Previous Post