Blog
All Blog Posts | Next Post | Previous Post

 The Next Evolution of Charting in Delphi: Getting Started
Tuesday, March 3, 2026
Versatile and flexible charts with Delphi & C++Builder
TMS FNC Chart brings powerful charting to modern Delphi and C++Builder applications. In this introduction, we highlight what you can build today: rich chart types, broad platform support, flexible data binding, and visual customization through both code and designer tooling.
Watch The Video
Watch the full intro walkthrough on YouTube:
Quick Highlights
One chart component family for VCL, FMX, and TMS WEB Core.
Broad chart coverage: business, XY, financial, and special chart types.
Fast design-time workflow with integrated editors and deep runtime control.
Frameworks and Targets
TMS FNC Chart is built to work across multiple frameworks and target platforms, making it a practical choice for cross-platform charting projects.
Platforms: Windows, macOS, Android, iOS, Linux, and Web.
Frameworks: VCL, FMX, and TMS WEB Core.
Highlight: Build once and target desktop, mobile, Linux, and web from the same charting toolbox.
Chart Types at a Glance
The intro video walks through the wide set of available chart types, from simple business charts to financial and scientific visualizations:
Line & Area family: Bar, Stacked Bar, Line, Area, Stacked Area (absolute and percentage).
XY charts: XY-line and XY-scatter.
Multi-point charts: OHLC, Candlestick, and Boxplot.
Other styles: Pie, Donut, Spider, and Markers.
Highlight: Switch chart styles quickly without redesigning your full UI.
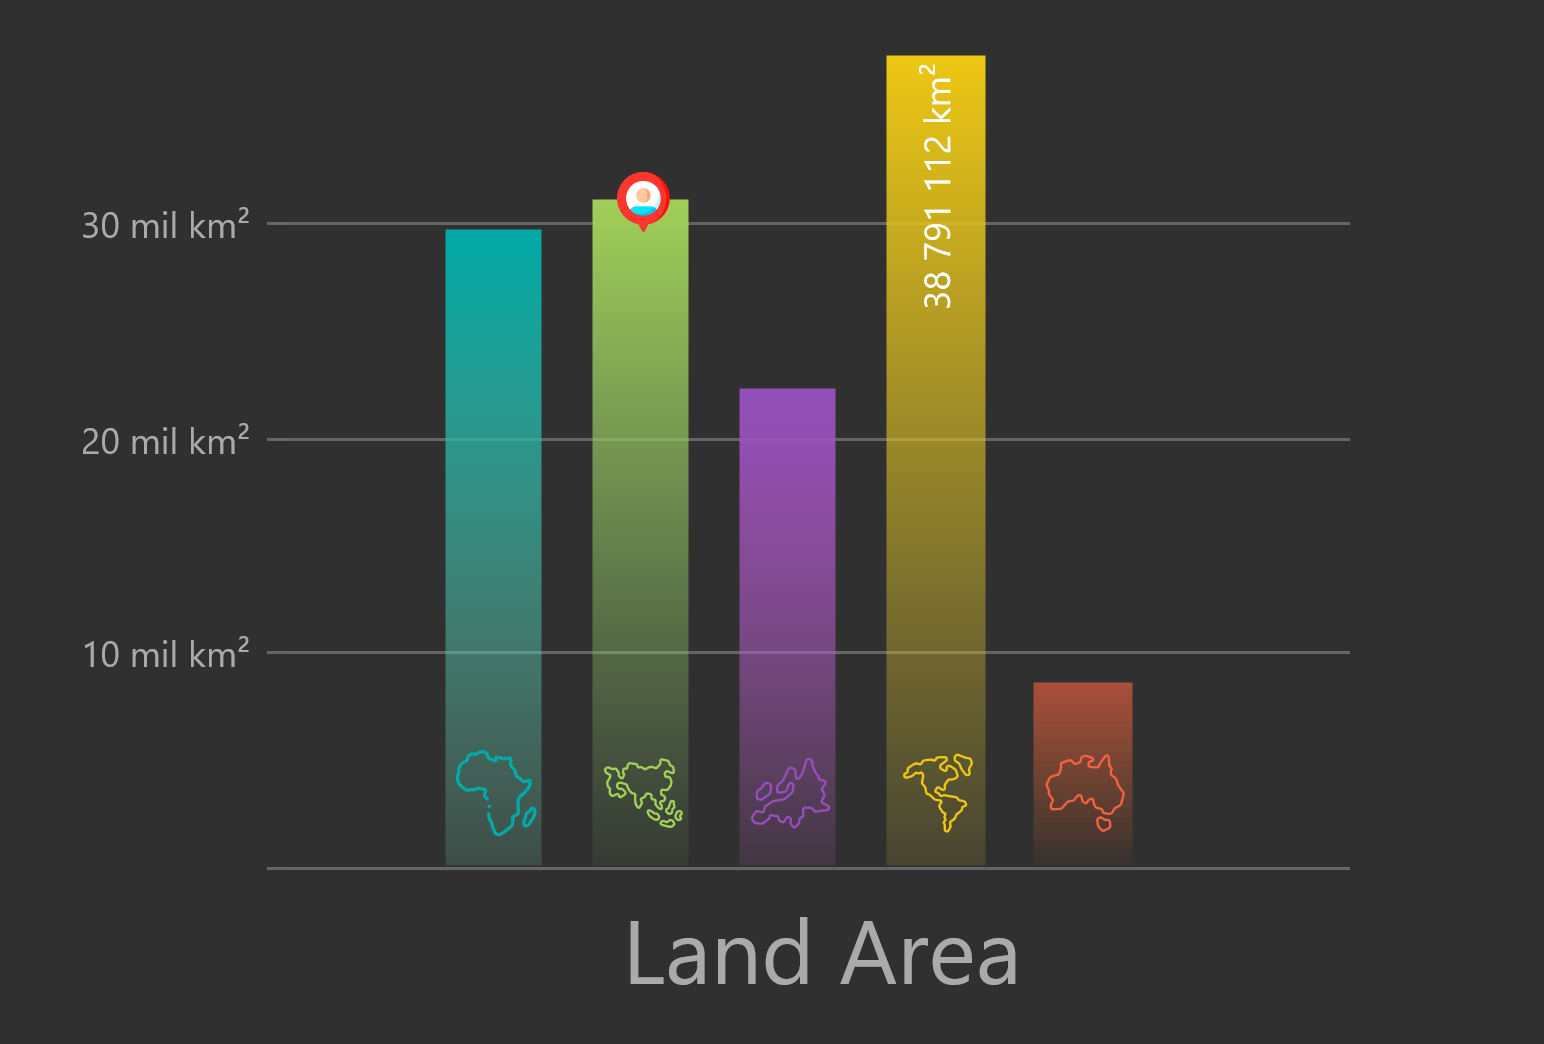
Chart type flexibility including bar and stacked representations.
Binding to Data
Whether your data comes from files, datasets, or computed values, TMS FNC Chart gives you multiple integration paths:
CSV and JSON data import.
Interface to
TDataSet.Interface to grid data.
Interface to math functions.
Highlight: Connect charts to file data, datasets, grids, or computed values with minimal glue code.
Highly Customizable
One of the core strengths shown in the video is how much control you have over chart presentation and interaction:
Design-time and run-time chart editors.
Legend, markers, and annotations.
Full X-axis and Y-axis formatting, zoom, and ranges.
Linear and logarithmic scales.
Animations and 3D drawing mode.
Mouse and keyboard interaction support.
Highlight: Use the editor for fast visual tuning, then finalize details in code when needed.
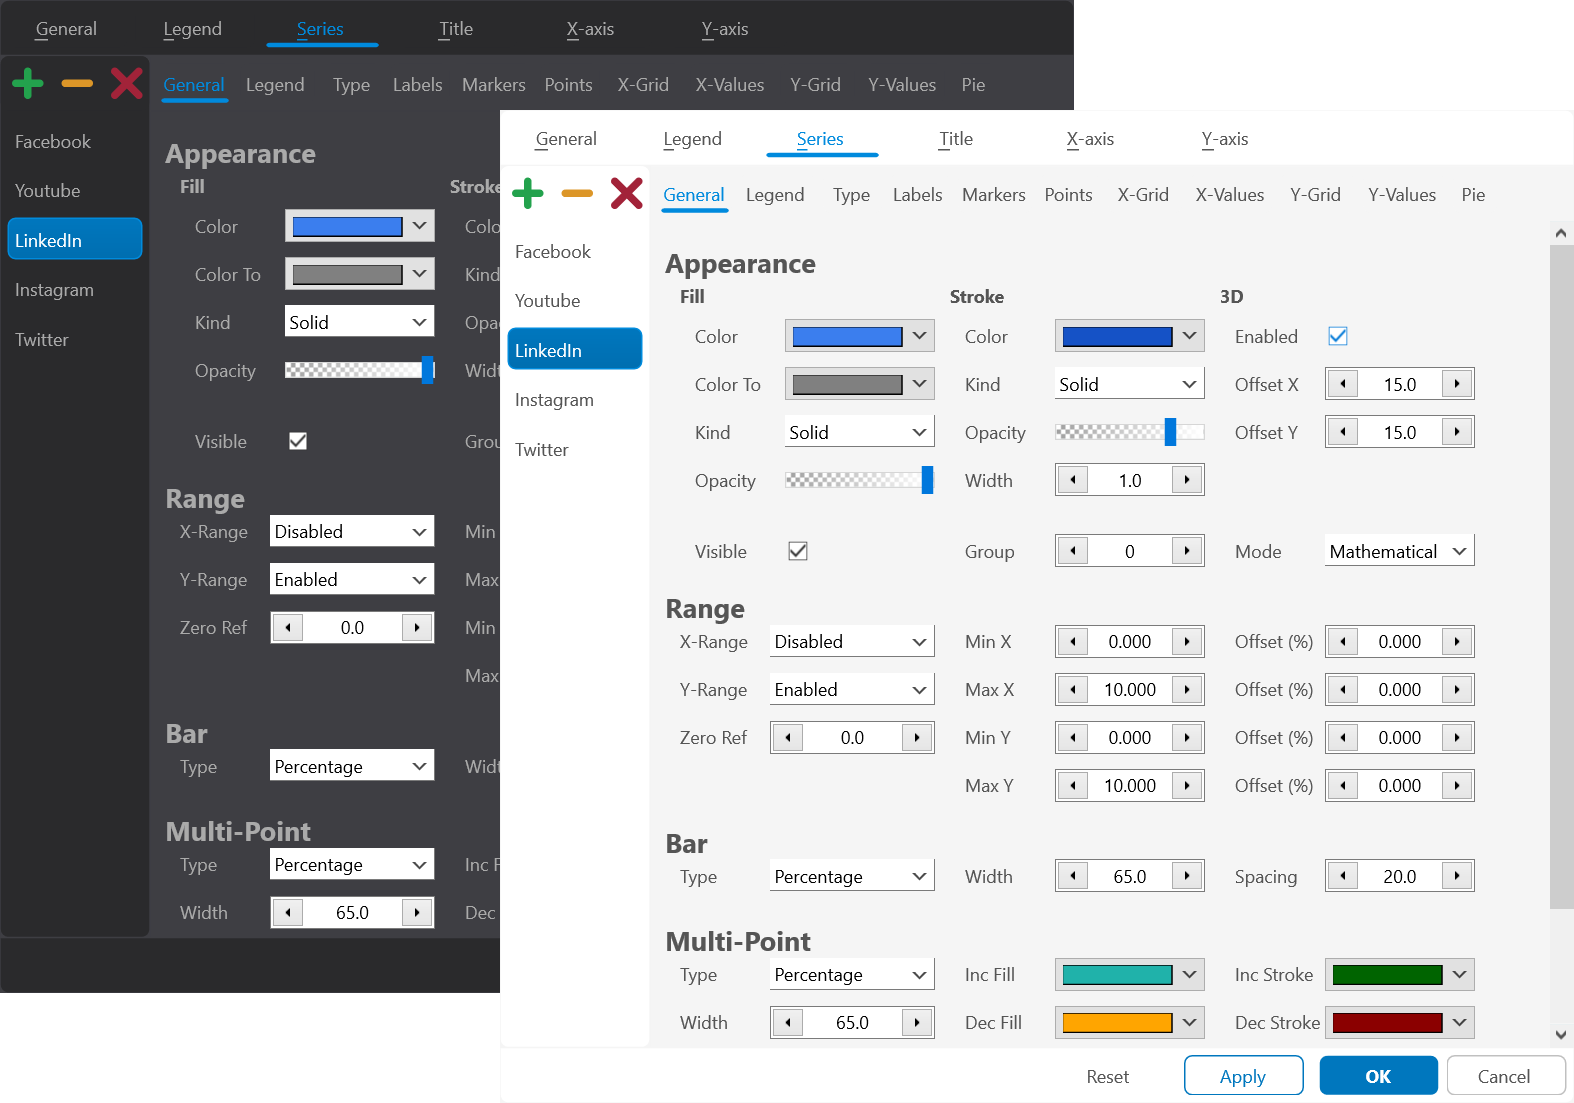
Design-time and run-time editor for fast chart customization.
Live Demo Workflow
In the demo section, a TTMSFNCChart is dropped on a form and configured with the integrated Chart Editor. The editor allows quick changes to chart type, series appearance, axis settings, title, and legend. This makes it easy to prototype chart designs visually before fine-tuning behavior in code.
Highlight: Prototype in minutes: drop chart, open editor, adjust, run.
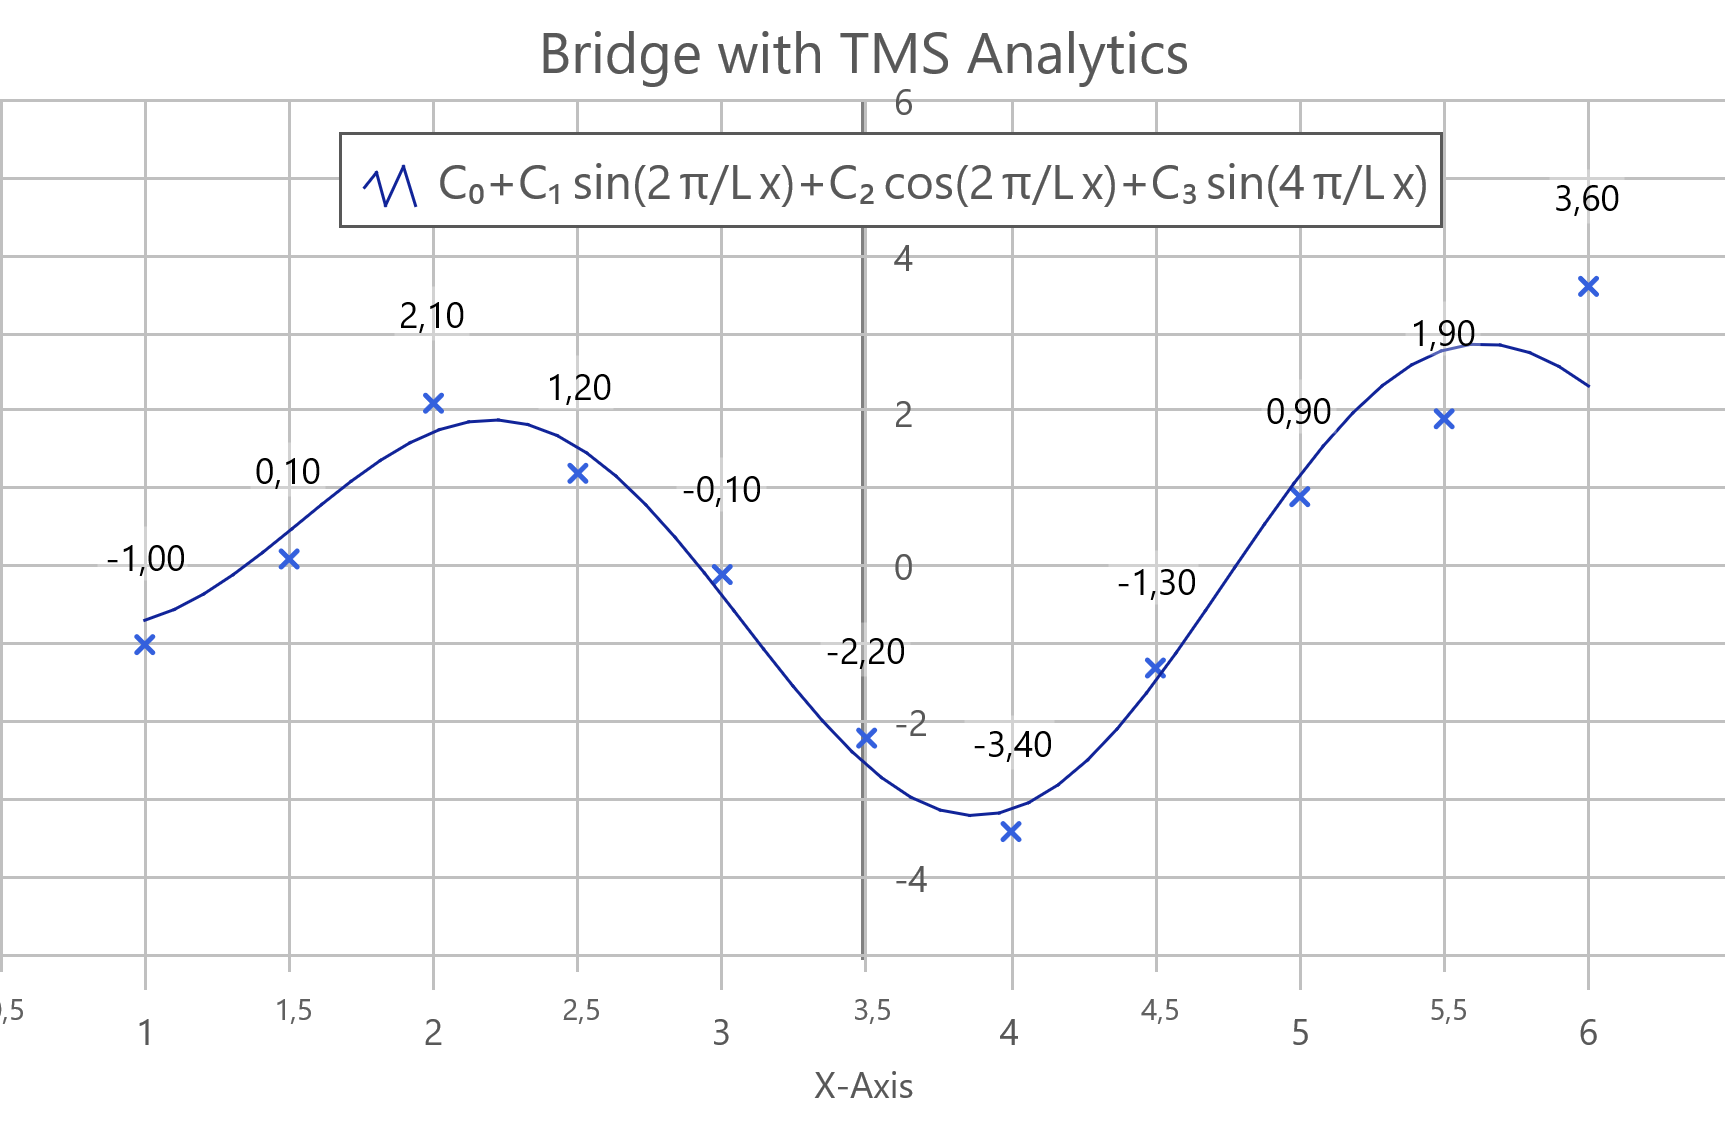
Live workflow example with advanced analytics-style charting.
Also New in TMS FNC Chart 4.0
Alongside the general introduction, the latest 4.0 update adds practical improvements for modern layouts and readability:
Horizontal mode via
Orientationfor flexible layout scenarios.Smart Labels for clearer axis labels with automatic spacing and rotation.
Switch between vertical and horizontal orientation with one property:
TMSFNCChart1.Orientation := coHorizontal;  // Horizontal layout
TMSFNCChart1.Orientation := coVertical;    // Default vertical layout
Enable Smart Labels for cleaner X-axis rendering:
with TMSFNCChart1.Series[0].XValues.SmartLabels do
begin
  Enabled := True;
  AutoRotate := True;
  MinLabelSpacing := 8;
  MinLabels := 3;
  MaxLabels := 10;
end;
Conclusion
TMS FNC Chart combines broad platform coverage, deep customization, and fast visual tooling in one component set. If you are building data-driven desktop or web apps in Delphi/C++Builder, this is a strong foundation for charts that are both functional and presentation-ready. Stay tuned for follow-up posts and videos where we dive deeper into real-world chart scenarios and best practices.
Pieter Scheldeman
Related Blog Posts
-
TMS FNC Chart 4.0
-
The Next Evolution of Charting in Delphi: Getting Started
-
The Next Evolution of Charting in Delphi: Data Import & Export
-
The Next Evolution of Charting in Delphi: Look & Feel
-
The Next Evolution of Charting in Delphi: Data Binding
-
The Next Evolution of Charting in Delphi: Multipoint Series

This blog post has not received any comments yet.
All Blog Posts | Next Post | Previous Post