Blog
All Blog Posts | Next Post | Previous Post

 Extend TMS WEB Core with JS Libraries with Andrew:
Basics Part 5: d, div, debugger, Debug, and Deployment
Wednesday, August 9, 2023

When developing applications, one of the first things developers can benefit from is a
solid understanding of how the code they write is actually executed. When errors occur, a process of
"debugging" takes place, where the developer tries to figure out what bit of code or what conditions caused the
error, and what can be done to correct it. Each development environment, whether it is just a simple
command-line-driven C application, or something enormously more complex, will have a suite of tools to help with
this process. TMS WEB Core is of course no different, so in this post, we'll look at some of the simpler ways we
can discover what our app is up to.
Designing A Sample Project.
To get started, we're going to create a fun little project that we can use to help demonstrate the aspects of app debugging we're going to cover. The sample project is intended to be simple enough for anyone to understand, but complex enough that we can see what is going on in a more visual way, rather than just picking over browser error logs.
The basic idea is that we're going to generate an image containing a pattern that uses a very simple algorithm. We'll be constructing an SVG image, so we don't have to worry about resolutions, graphics libraries, or anything of the kind. We can construct the image just as we would a dynamic block of HTML. Part of the algorithm involves a loop and by stepping through the execution of that loop, one iteration at a time, we can see the pattern develop, as well as all the internal state that our application is using along the way.
d
When constructing an SVG file, we'll need a few attributes for the <svg> element itself. Inside the <svg> element, there can be many other kinds of elements. What we're interested in today is the <path> element - for drawing a path, naturally. The <path> element has a path definition attribute, d, that can be used to describe a series of path commands. The commands we're interested in here are the move command "M" and the line command "L".
Each command can have parameters. The coordinate system used by SVG has (0,0) located in the top-left corner by default. For the move command, we can provide a new position as an (x,y) coordinate in this coordinate system. Using "M" will move to an absolute coordinate. Using "m" will move relative to the current position. Similarly, the line command takes a pair of (x,y) coordinates and draws a line from the current position to the position specified, where "L" draws a line between absolute coordinates and "l" draws a line between relative coordinates.
To draw a pattern will involve constructing a series of these commands and assigning them to the d attribute of the <path> element within the <svg> element. To help simplify this a little, we're going to be drawing our pattern inside a unit circle (aka a circle with a radius of 1). As SVG images are, by their very definition, vectors, it doesn't matter too much how big our pattern is as we can scale it easily to fit whatever size we want.To draw our pattern inside the unit circle, we'll shift the SVG's viewBox so that the coordinate (0,0) is in the center. The y-axis is still reversed compared to what we normally use in traditional math functions, so we'll just add an extra -1 multiplier when we add the coordinates to the list of commands. To give a little extra room for thick lines, we'll add a 10% buffer to our viewBox.
This SVG attribute can be
thought of as a "window" of sorts into the underlying image that is shown - nothing drawn outside of it will be
visible, and there isn't an "overflow" option as we have with other HTML elements. As a result, we'll define
it as viewBox="-1.1 -1.1 2.2 2.2" which gives us a square that is 2 units wide, where (0,0) is in the center,
with 0.1 units of extra space around it. Technically we're talking about pixels, but it really doesn't matter
as the SVG in this case will be scaled to fit its container.
<div>
In order to display an SVG file on an HTML page, we don't really have to do very much - we could just add it as an element all its own. But we'd like to have a bit of control over its display, so we'll put it inside an HTML container of some kind. The most generic, and most common, HTML container is called a <div> element (or division element). The TMS WEB Core equivalent is a TWebHTMLDiv component.
By default, a <div> element might not even be visible on the page, as without borders, background, or content, there's nothing for the browser to render. This invisibility property is very useful when using them as containers for other elements, as they don't necessarily have to include any styling of their own. Which is largely what we're after here.
We can adjust the <div> element to appear wherever we want on the page, setting its position or size as we
see fit. Let's say we want the <div> element to take up most of the page, center it, and have it appear
under whatever else might be on the page. We could create a CSS class with these properties and assign the class to
the ElementClassName property of a TWebHTMLDiv component, where the CSS was defined in a separate CSS file. Or
if there are just a handful of properties, and we're not reusing these for other elements, we can just apply
them directly.
WebHTMLDiv1.ElementHandle.style.setProperty('z-index','-1');
WebHTMLDiv1.ElementHandle.style.setProperty('overflow','visible');
WebHTMLDiv1.ElementHandle.style.setProperty('position','absolute');
WebHTMLDiv1.ElementHandle.style.setProperty('top','50%', 'important');
WebHTMLDiv1.ElementHandle.style.setProperty('left','50%', 'important');
WebHTMLDiv1.ElementHandle.style.setProperty('width','80%', 'important');
WebHTMLDiv1.ElementHandle.style.setProperty('height','80%', 'important');
WebHTMLDiv1.ElementHandle.style.setProperty('transform','translate(-50%, -50%)');
This will set the size of the <div> to 80% of the available width and height. The overflow property indicates that we want whatever is in the <div> to be shown, even if it goes past the boundaries that we've established here. The transform property is used to display the <div> in the middle of the page.
We
will want our SVG to scale automatically to fit inside this <div> element. To do that, we just set its
width to be 100% and the rest is taken care of for us. Here's what our <SVG> definition will start out
with.
  SVG :=       '<svg ';
  SVG := SVG +   'id="SVG" ';
  SVG := SVG +   'width="100%" ';
  SVG := SVG +   'height="100%" ';
  SVG := SVG +   'viewBox="-1.1 -1.1 2.2 2.2" ';
  SVG := SVG +   'xmlns="http://www.w3.org/2000/svg"';
  SVG := SVG +   'style="';
  SVG := SVG +     'fill: none; ';
  SVG := SVG +     'stroke: #'+ColorToHex(WebColorPicker2.Color)+'; ';
  SVG := SVG +     'stroke-linecap: round; ';
  SVG := SVG +     'transition: left 500ms, top 500ms, transform 500ms, stroke 500ms; ';
  SVG := SVG +     'transform: scale('+WebEditScale.Text+') translate('+WebEditLeft.Text+'%, '+WebEditTop.Text+'%) rotate('+WebEditRotate.Text+'deg) ; ';
  SVG := SVG +     'stroke-width: '+FloatToStr(StrToFloat(WebEditLineWidth.Text)/1000.0)+'; ';
  SVG := SVG +   '">';
  SVG := SVG + '</svg>';

  WebHTMLDiv1.HTML.Text := SVG;
We'll talk about the style attribute in just a moment, but this is enough to get our SVG rendered onto the page. By assigning our generated SVG file (which is just a string) to the HTML property of our TWebHTMLDiv, we've done the equivalent of replacing the <div> contents, which is also equivalent to using the JavaScript innerHTML property.
Drawing Parameters.
In order to draw our pattern, we've got a handful of parameters that we can adjust.
- Points. We're going to draw a circle with an arbitrary number of points around it.
- Line Width. This describes how thick the connecting lines will be.
- Offset. How many points to skip between line ends.
- Scale. Multiplier for the image.
- Rotate. Applied to the image.
- Left/Right. Translate the image horizontally.
- Up/Down. Translate the image vertically.
- Background. Color applied to the page.
- Foreground. Color applied to the pattern.
The algorithm for our pattern involves simply drawing lines between pairs of points. If we had a set of 16 points evenly distributed around a circle, we'd draw lines between point 1 and 2, point 2 and 3, point 3 and 4, and so on. If the offset was, say, 2, then we'd draw lines between point 1 and 4, point 2 and 5, point 3 and 6, and so on. The math bit involves getting the (x,y) coordinates for the points around the circle, but as this is a unit circle, it's not too much of a challenge.
// Start at (0, 1) - the top of the circle
// Iterate through all of the points
// This is the list of line segments that we're building
Segments := '';
// Number of points on the circle
P := StrToFloat(WebEditPoints.Text);
// What is the next point number relative to the current point
// alternatively, how many points are we skipping for each line segment
O := StrToFLoat(WebEditOffset.Text);
// Start at the top of the circle and work our way around
X1 := 0.0;
Y1 := 1.0;
// Going to draw one line for each point, from (X1,Y1) to (X2,Y2)
for i := 1 to Trunc(P) do
begin
// Get the next end point, factoring in offset
A := ((i + O) / P) * Pi * 2;
X2 := sin(A);
Y2 := cos(A);
// Move to start point, draw line to end point
Segments := Segments + 'M'+FloatToStr(X1)+','+FloatToStr(-Y1)+' ';
Segments := Segments + 'L'+FloatToStr(X2)+','+FloatToStr(-Y2)+' ';
// Set (X1,Y1) to next point in circle
A := (i / P) * Pi * 2;
X1 := sin(A);
Y1 := cos(A);
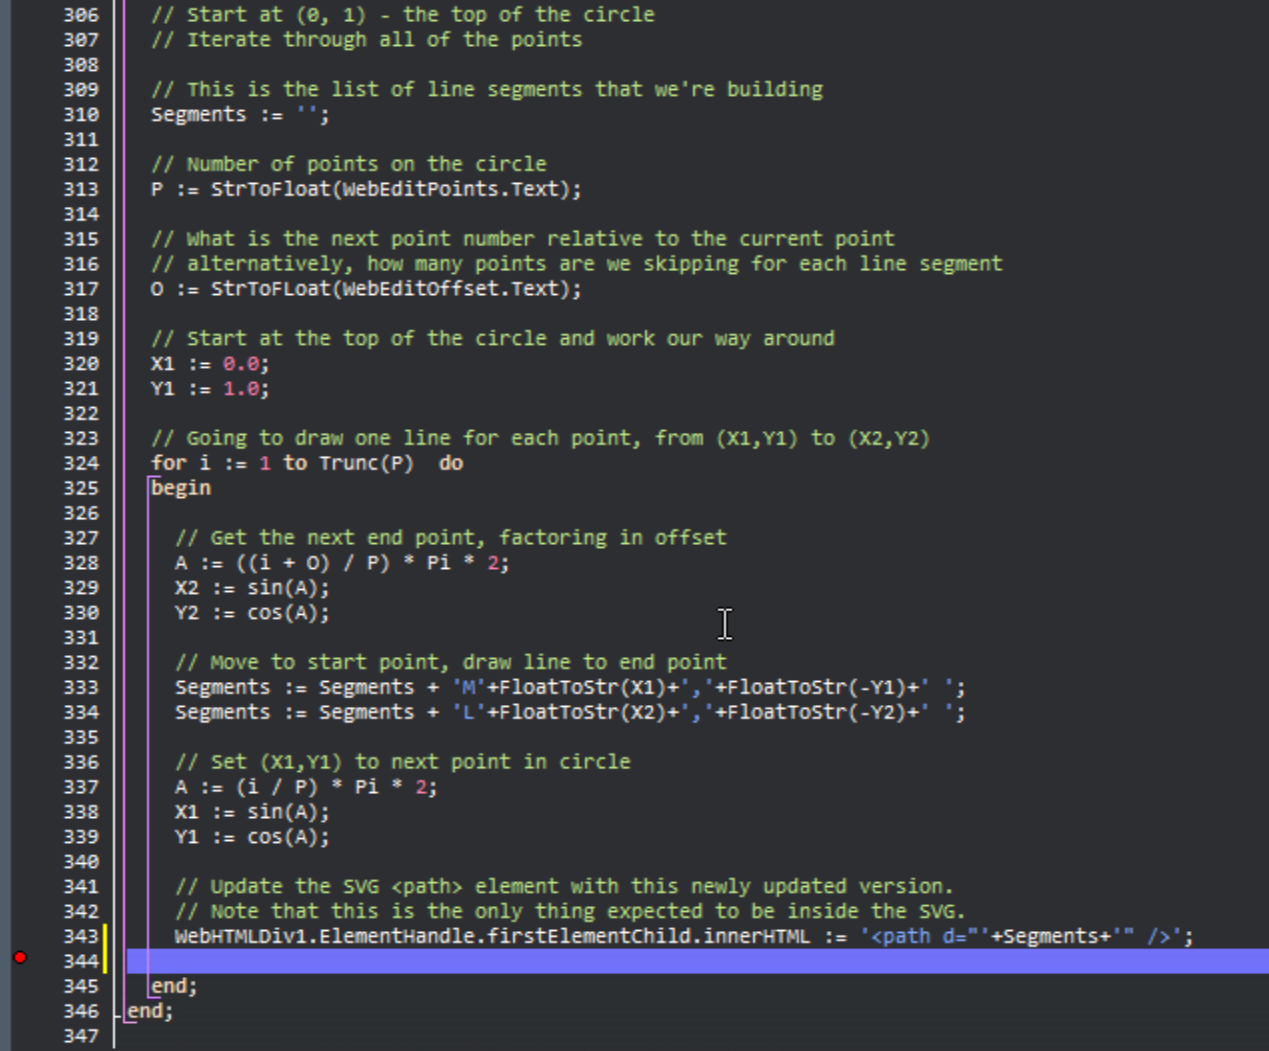
// Update the SVG <path> element with this newly updated version.
// Note that this is the only thing expected to be inside the SVG.
WebHTMLDiv1.ElementHandle.firstElementChild.innerHTML := '<path d="'+Segments+'" />';
end;It might take a bit of effort to visualize what this looks like, so let's have a quick peek.
Our Sample Project in Action.
Each of our TWebTrackBar components (aka range sliders or just sliders) is tied to a TWebEdit component showing
its position value. This includes a multiplier in the case of the Line Width parameter, as the line widths
we're dealing with are remarkably small - remember our unit circle is drawn with pixels. Just to be fancy,
updating the TWebEdit component will also update the TWebTrackBar component, and the mouse wheel has been connected to each of them, making it easy to adjust the values and otherwise just play around with the
parameters. For example, here's how the first parameter, Points, is configured.
procedure TForm1.WebTrackBarPointsChange(Sender: TObject);
begin
  WebEditPoints.Text := IntToStr(webTrackBarPoints.Position);
  WebHTMLDiv1click(Sender);
end;

procedure TForm1.WebEditPointsChange(Sender: TObject);
begin
  if WebEditPoints.Text <> '' then
  begin
    WebTrackBarPoints.Position := Trunc(StrToFloat(WebEditPoints.Text));
    WebHTMLDiv1Click(Sender);
  end;
end;
In WebFormShow, the addEventListener method (in JavaScript) is used to call a Delphi function we've added, MoveSlider, in order to adjust the TrackBars with the mouse wheel.
procedure TForm1.WebFormShow(Sender: TObject);
begin

  asm
    function Move(trackbar, event) {
      pas.Unit1.Form1.MoveSlider(trackbar, event.deltaY);
      event.preventDefault();
      event.stopPropagation();
    }

     WebEditPoints.addEventListener('wheel', function(event) { Move(1, event)});
     WebTrackBarPoints.addEventListener('wheel', function(event) { Move(1, event)});
  end;

end;

procedure TForm1.MoveSlider(trackbar: integer; amount: Double);
begin

  // Points
  if (trackbar = 1) then
  begin
    WebTrackBarPoints.Position :=  WebTrackBarPoints.Position + Trunc(amount/-100);
    WebTrackbarPointsChange(nil);
  end
The WebHTMLDiv1Click event is what contains the pattern drawing algorithm. It pulls in each of the values from the TWebEdit components, as well as the two colors from the TWebColorPicker components. Some of these are used in the algorithm directly, such as the points and offset values, whereas others are used in adjusting the style properties of the SVG element.
In particular, the values for the transform CSS property, scale, rotation, and translate, are set via the style properties. And, along with the stroke color, the transition property is used to animate updates to these properties, making those changes a little smoother. Changing the points or offset values regenerates the entire pattern anyway, so a transition there would be considerably more difficult.
Debugging.
In our algorithm, each time we add a new line to our pattern, we update the SVG element with the new version of the <path> element. In practice, this would be quite a waste of resources - we should just wait until the entire pattern is added to our d element and then update the <div> on the page one time. But that wouldn't be as fun to debug. Writing the code this way, we can set a breakpoint that will then stop the process after each line is added to the pattern.In a traditional Delphi VCL app, we can set a breakpoint in our code by clicking beside the line number in the IDE editor. And in TMS WEB Core projects, we can do the same thing. So let's set a breakpoint just after the <div> element is updated with the new version of the pattern.
Setting a Breakpoint in our Delphi Project.
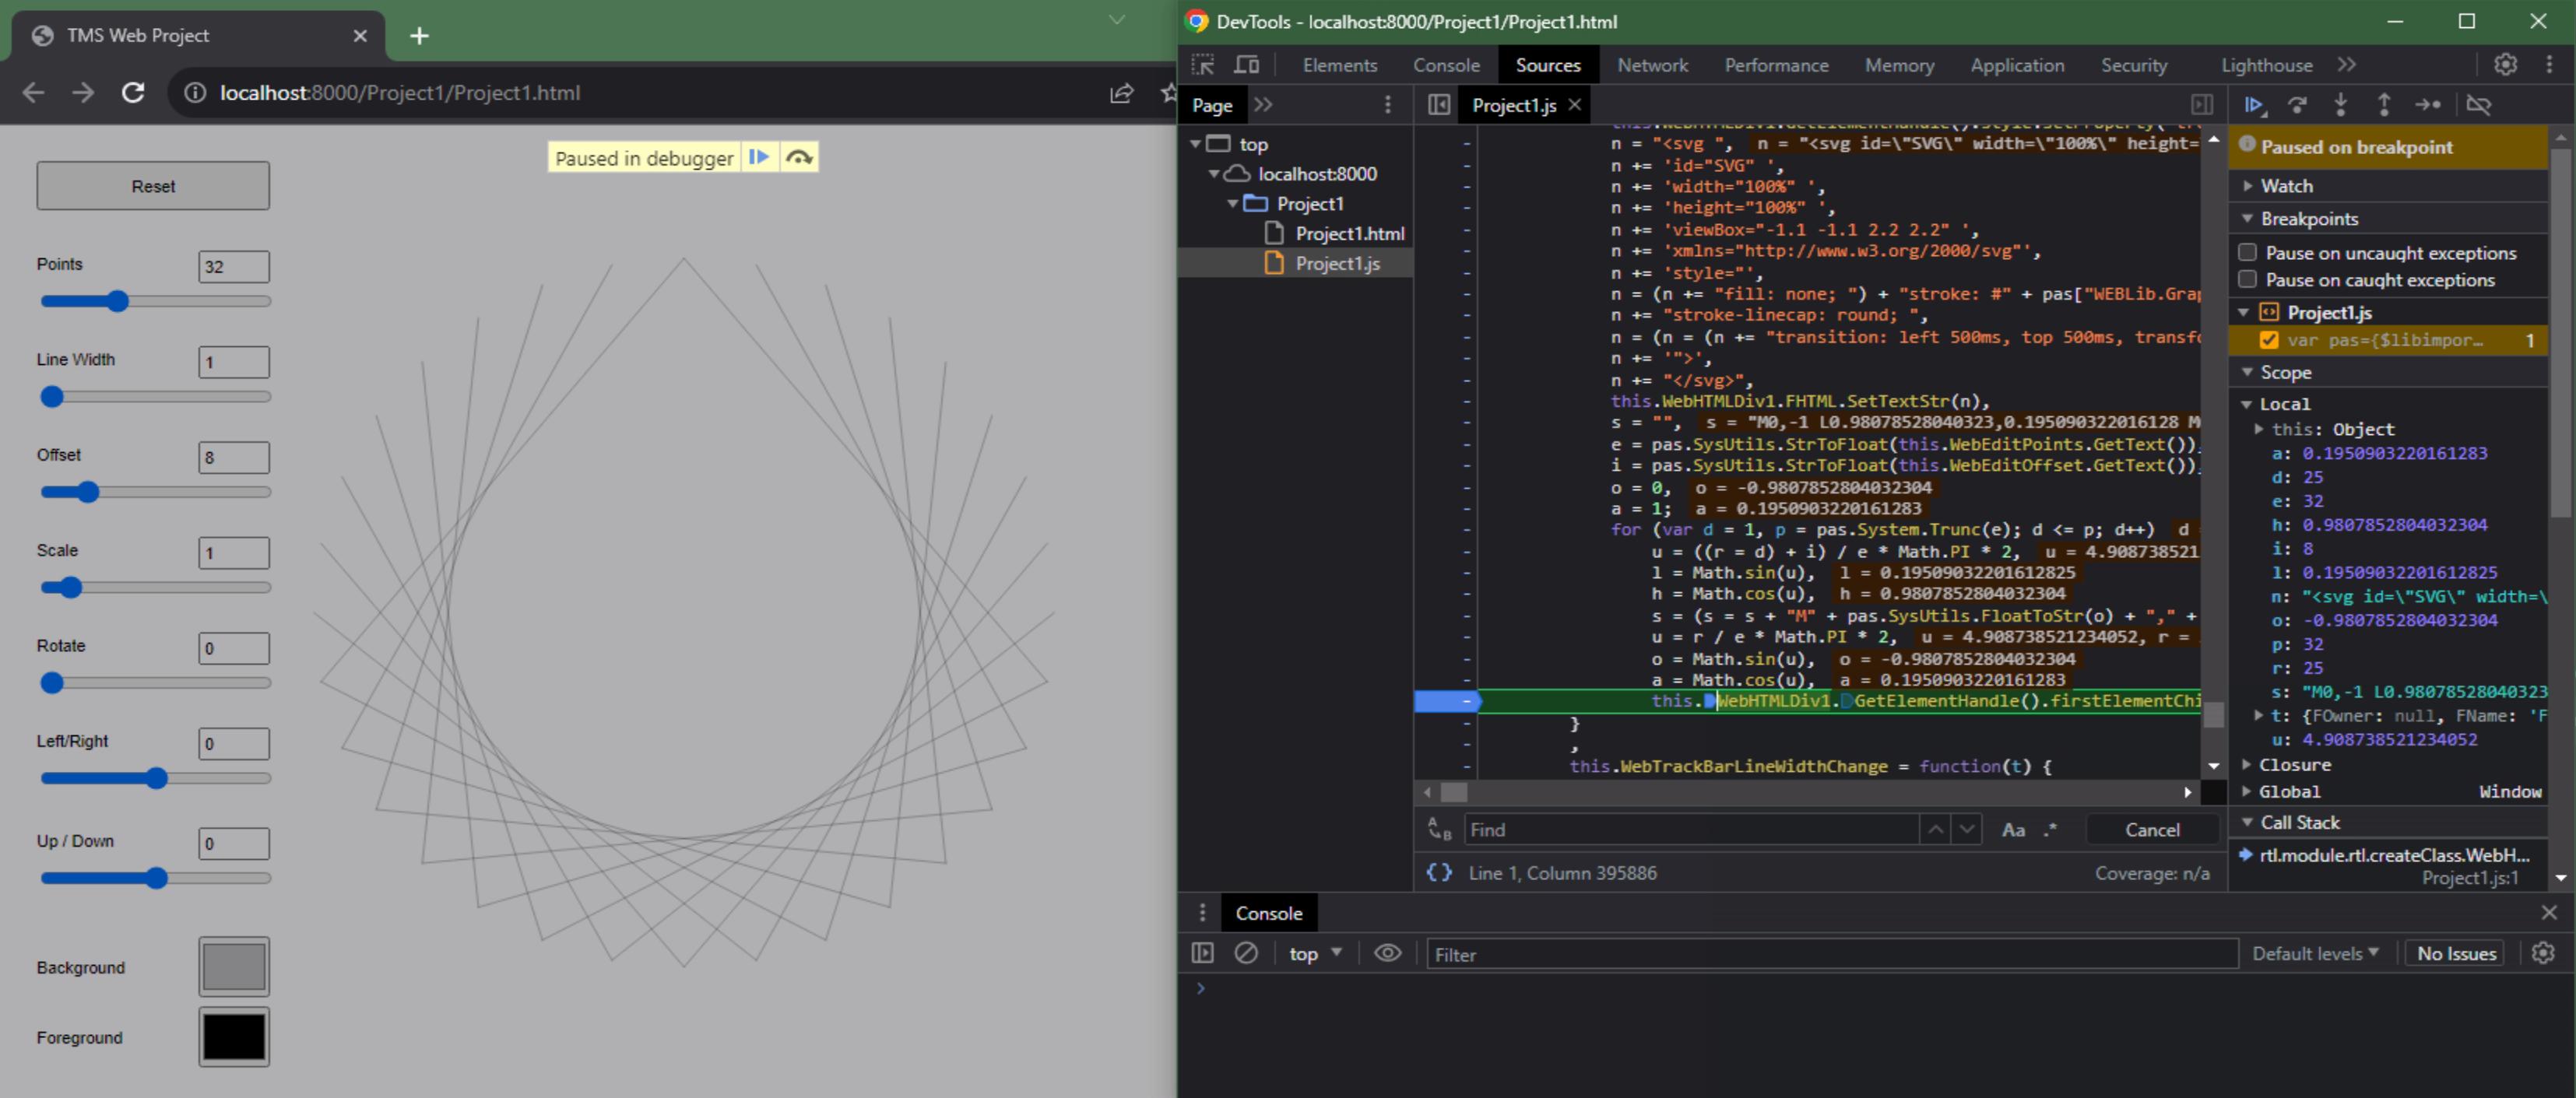
This means that we want our code to stop executing as soon as we've drawn the first segment in our algorithm. If we then run the project, we'll see that it does exactly this. Note that in the screenshot below, we're using
Chrome and the browser DevTools window is open (hit F12 to toggle this). It is also arranged as a separate window. By default, the DevTools window appears attached to the right side of the current page. When the app first launches, without the browser developer tools window open, nothing is
different, but when reloading the page, we can see that it stops exactly where we expected - immediately
after drawing the first line of our pattern and adding it to the page.

Browser DevTools - Breakpoint Enabled.
What is especially interesting here is that everything we're looking at is based on our Delphi project - Delphi
and not JavaScript code is displayed, and our breakpoint is highlighted. The source code on the left of the DevTools window is exactly the code we were looking at
in the Delphi IDE, including all of the comments. The variables on the right include all the variables that are
part of our function, including the current values for (X1,Y1) and (X2, Y2) when the breakpoint was reached. And the Call Stack shows how we ended up at that point in our code.
On the one hand, this is pretty exciting as it means that it is very easy to see what is going on in our application at any time, and we don't really have to know anything about JavaScript at all to make use of this capability - we can instantly recognize our code, see the variables and their current values, all with very little effort.
On the other hand, this is a clear indication of why we repeatedly talk about how we don't want to store secrets of any kind in our web apps - anyone with a browser can do the same thing to see what is going on inside an app running in the browser. The very same DevTools window is available pretty much in every web browser running on every platform. There's more to that story which we'll get into a little later when we talk about releasing our code into the wild, but the general idea still holds - anyone can see the code running inside the browser, so don't put anything there you don't want to share with everyone.
If we want to see how our algorithm works, we can use the step button beside the "Paused in Debugger" message on the left to run through a few more iterations. Clicking on it a few times gets us a bit more of the pattern revealed. On the right, we can see the variables updated - our value for i is now 9, for example, indicating that we've drawn lines from the first 9 points, which is indeed exactly what we see.
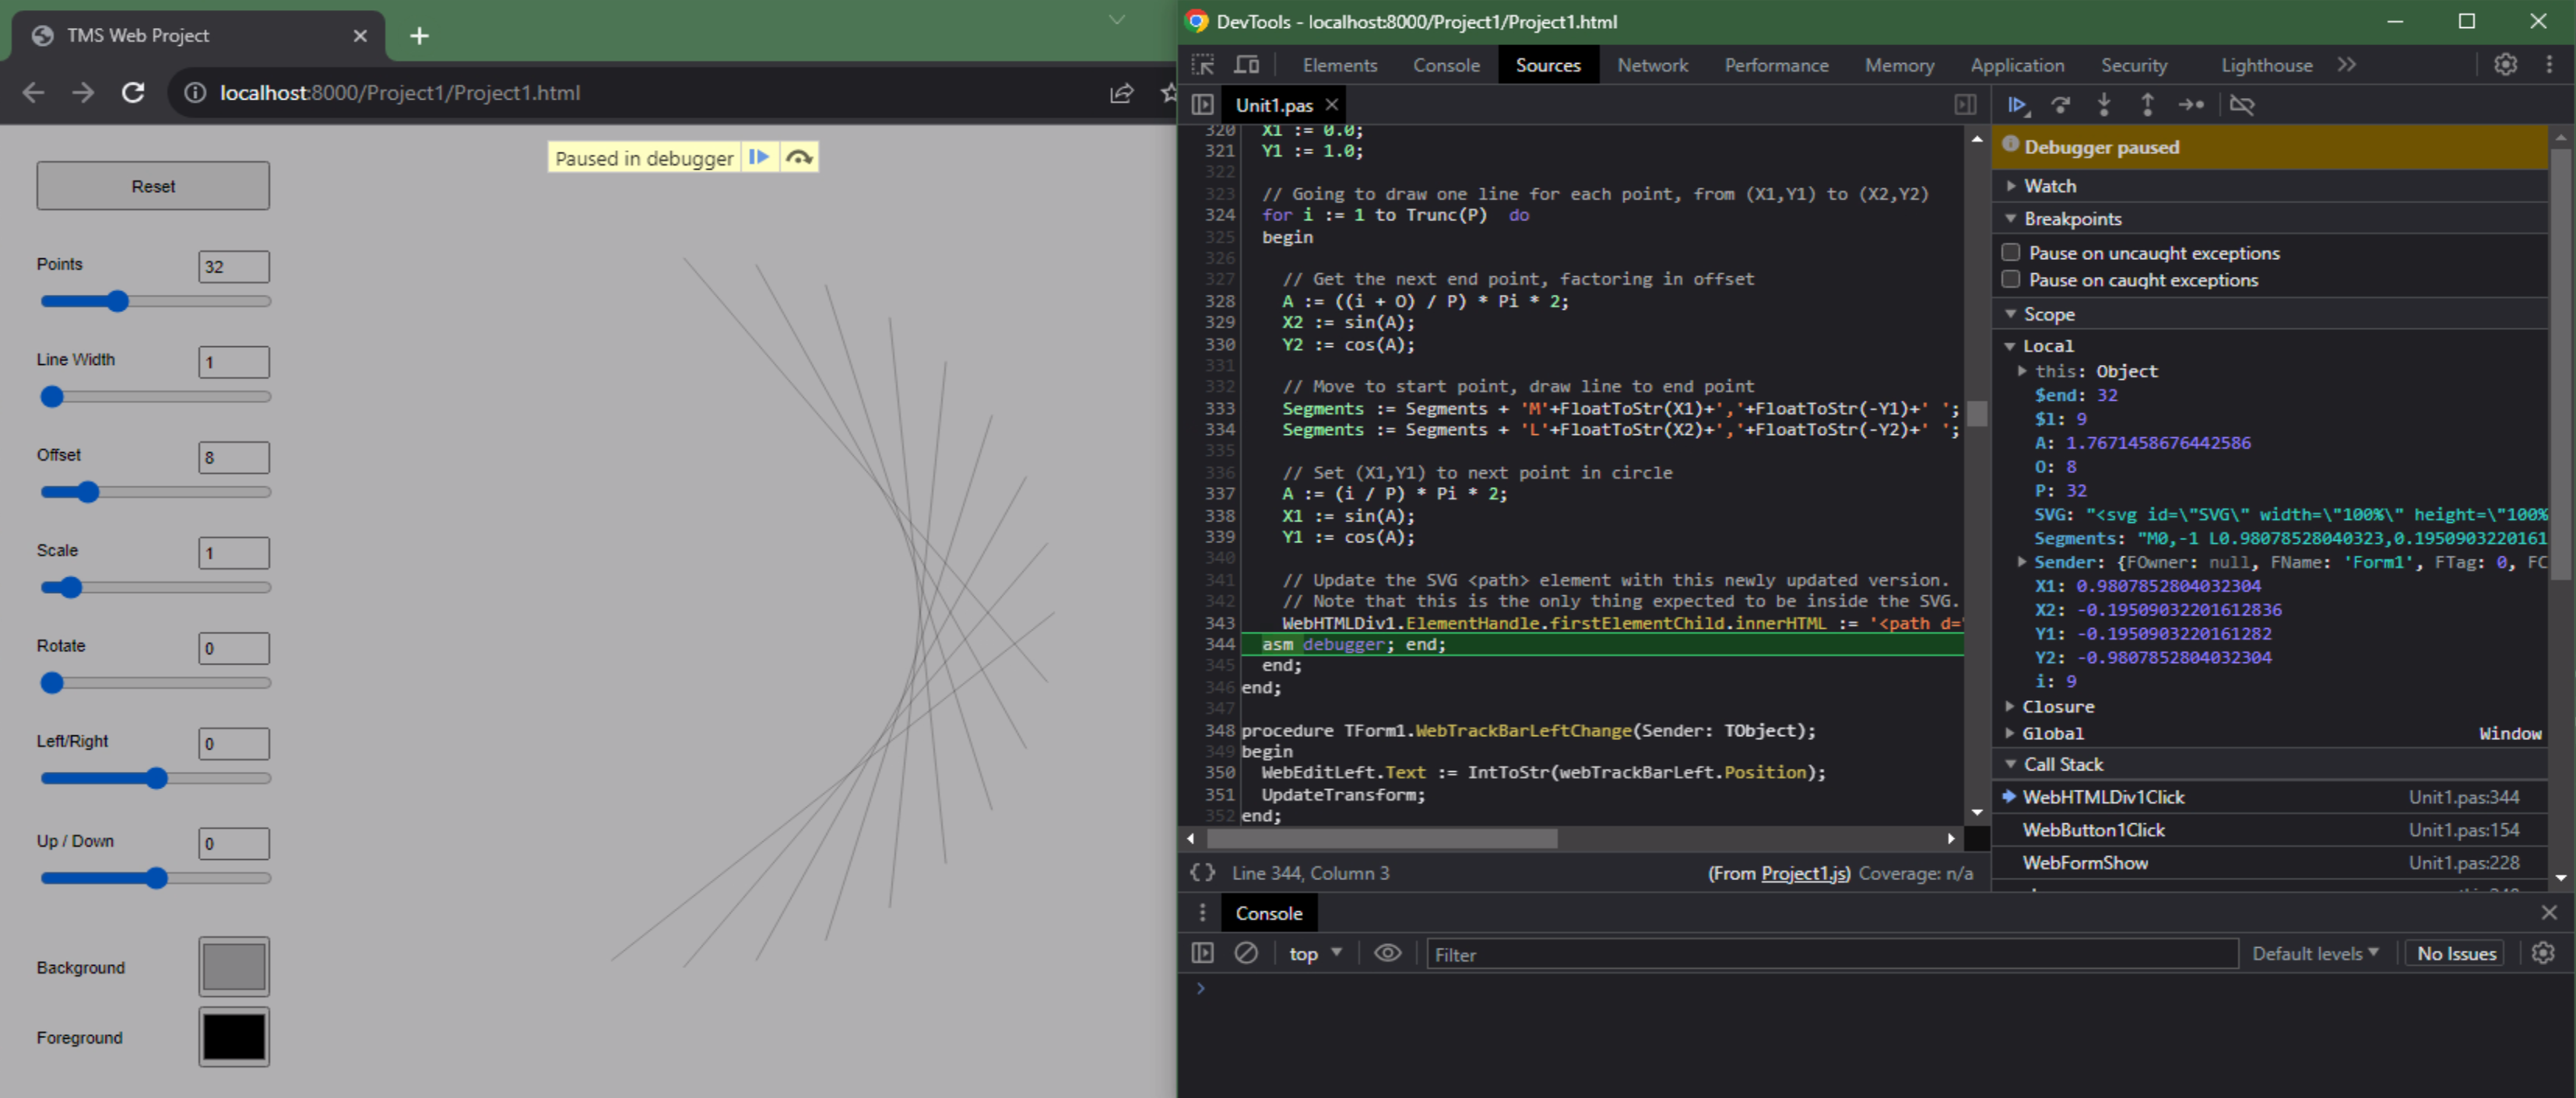
Stepping Through Code.
Using either the left button appearing beside the "Paused in Debugger" message, running until the breakpoint is hit again, or the right button, stepping through each
line of code individually, you can easily see how the code execution meshes with what is displayed on the page. If your app logs anything via a call to console.log, it will also appear at the bottom of the DevTools window.
When the app is paused, or even when it is not, you can also see what is going on directly on the page by looking at the Elements tab in the DevTools window. Here, we can see our SVG that has been rendered on the page after 20 steps of the algorithm have been completed.
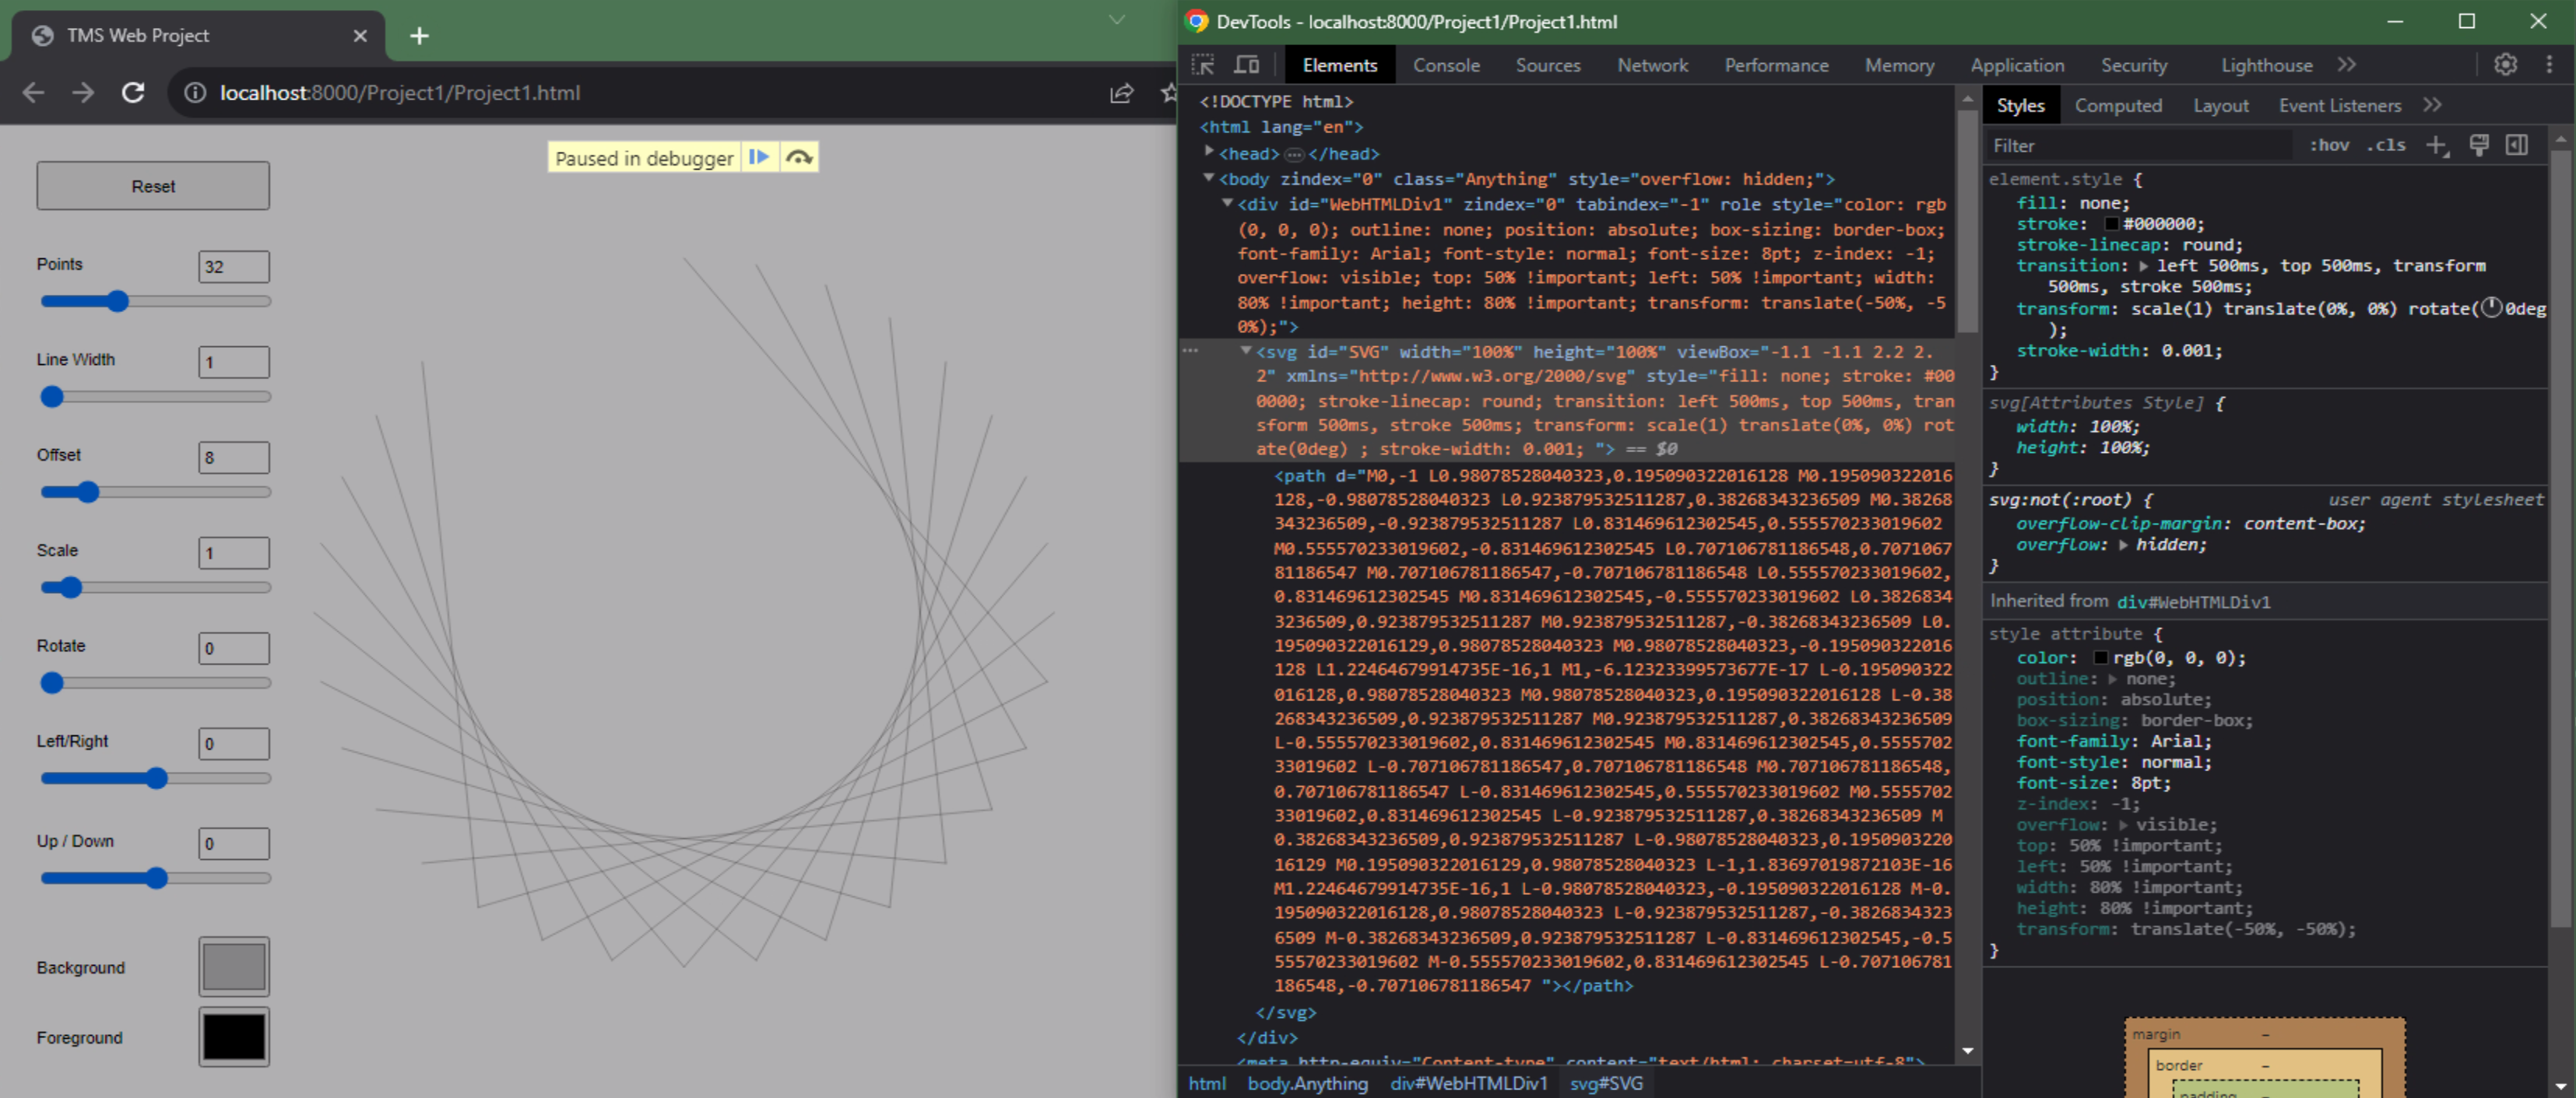
Visualizing the Algorithm.
In this way, we can see how the page is updated as our algorithm works its way through each of the points. This
is why we constructed the algorithm to update the SVG after every iteration. If anything is amiss, we can see
the results rendered directly on the page. If we were working on some other kind of app, like perhaps a payroll
app of some kind, we could use the same tools to see what intermediate values were used in a calculation that is
displayed on the page, rather than having to display those values on the page directly. We could also do this by using hidden elements on the page, by displaying console messages, or just by looking at the values assigned to those variables.
A quick note about caching. This ability for the browser to present us with a view of our Delphi code comes by
way of .map files. These files are quite large and contain a lot of debugging information, such as our Delphi
code, that we don't necessarily want to share with everyone, which we'll address a bit later. More pressing is
that sometimes, when making changes to our app, we're presented with an older version of our code. This is
because the underlying .map file has been cached by the browser. Turning off the breakpoint, for example, and
running our sample app again will show that the breakpoint is still there. To tell the DevTools to not cache
files, there's a flag on the Network tab - Disable caching. We'll want to disable caching so that this .map
file is reloaded each time, while we're using the debugging tools in this fashion.
Debugger.
In the above example, we set the breakpoint using the Delphi IDE which in turn launches the browser's JavaScript
debugger. We can also disable that breakpoint or add new breakpoints while working within the DevTools
interface, making it easy to move around the bits of code we're troubleshooting. Sometimes, though, we'd like to
go in and have a look without first having set a breakpoint in the Delphi IDE. We can do this just by launching
the debugger from the browser console using the debugger command explicitly.
debugger
This immediately stops our app and puts up the now familiar "Paused in Debugger" message. But we'll have to navigate to the Source tab and find our code if nothing is currently happening in our app. Normally we can just do that without even running the debugger command, so this might not seem very useful. Sometimes, though, we might want to look at our code when it is in a certain state. For example, after we've logged in, when we've clicked on a button that brings us to a particular part of our app, or when it is showing a specific menu drop-down or form we're interested in testing.
Dynamic visual elements can be particularly difficult to troubleshoot. Especially those where the display of an element is triggered by mouse events. Say, for example, you're trying to adjust the styling for a drop-down menu that only appears when you've clicked an element in the parent menu. But as soon as you move the mouse out of the drop-down menu (and over to the DevTools window), the drop-down menu disappears, and you can't see its values in the Elements tab. This can also happen when looking at styles for other dynamic elements, like tooltips or transitions.
One way to get around that is to have the debugger triggered with a timer. As the console is capable of running
just about any JavaScript we throw at it, we can actually just call the debugger after a set period of time. To get
at the styling information for that drop-down menu, we can set a timer for 3 seconds - enough to click on
the menu - by running this from the console. Note that this is case-sensitive, as are most things in
JavaScript.
setTimeout(function() { debugger }, 3000);After three seconds have elapsed (or whatever value you've supplied as the last parameter to setTimeout), the debugger will be triggered and whatever is visible on the page will be frozen. You can then go and look in the Elements tab for the styles or other attributes for the drop-down you're examining.
Debug vs. Release.
Up to this point, we've been running under the assumption that our Delphi IDE has been configured to generate our project using the "Debug" build configuration - this is the default. In this mode, the .map file that we use to see our Delphi code in the DevTools window is generated for us. This is great for debugging, but we don't necessarily want that to be included in our project when it is deployed, for at least a couple of reasons. First, it is likely the largest file there and does nothing for our users. And two, even though others can still look at our code, we don't necessarily want to make it easy for them - the comments and other aspects of our code might be best kept to ourselves.
If we choose to use the Release build configuration instead, this map file is no longer generated. And if we were
to include a breakpoint in the Delphi IDE and then run through the same process, it is no longer included in our
code. But what we're presented with instead is the final 100% JavaScript implementation of our code - no Delphi
to be found anywhere. When we go and use the debugger to look at our code, we see its JavaScript equivalent.
Project Debugging via JavaScript.
Everything works the same here, just that we're in a pure JavaScript environment. We can still set breakpoints
and view variable values, but our Call Stack is a little less helpful and the code itself may have unfamiliar
references - revealing the underpinnings of how TMS WEB Core works. This can be rather interesting if you're curious
about how Delphi code is translated so effectively into JavaScript. But here again, we're reminded of just how much
of our code is visible to outsiders. Even after running through various optimization and obfuscation steps, it is pretty plain
what our algorithm is doing - no secrets here!
The size of our project is also now considerably smaller, with the folder contents going from around 6 MB to
around 0.5 MB.
Directory of c:\Users\Andrew Simard\Documents\Embarcadero\Studio\Projects\debug_demo\TMSWeb\Release

2023-07-29  00:27               560 Project1.html
2023-07-29  00:27           422,773 Project1.js
2023-07-25  23:03               195 Unit1.html
               3 File(s)        423,528 bytes

Directory of c:\Users\Andrew Simard\Documents\Embarcadero\Studio\Projects\debug_demo\TMSWeb\debug

2023-07-29  00:00               560 Project1.html
2023-07-29  00:00         2,482,633 Project1.js
2023-07-29  00:00         3,516,907 Project1.js.map
2023-07-25  23:03               195 Unit1.html
               4 File(s)      6,000,295 bytes
As this is a very small project, none of these files are particularly worrisome either way, but as your project grows, these can become considerably larger. The Release build applies numerous optimizations, stripping out all the code that we don't absolutely need in our application, and thus reducing its size considerably.
Deployment.
When deploying your project, unless you're deploying a version for other developers to test, you'll want to use the Release build configuration, as shown above, and copy just those files to your webserver of choice. Smaller file sizes are of course much better, and exposing less of the internal workings of your code is generally not a bad idea. It isn't any more secure necessarily - locked doors only keep honest people honest, as the saying goes. The JavaScript version of your code is still just as accessible to anyone else as it is to you. At the same time, this also means that you have a way to debug your app when running on other platforms, even after it is "in production".
Looking at the same code within Firefox running on Linux, we can get pretty much the same interface. Note that
even though our code has been obfuscated, we can still clearly see what is going on. On the right, the variable
names are different, but not hard to figure out. Our "i" variable is now "r" for example.
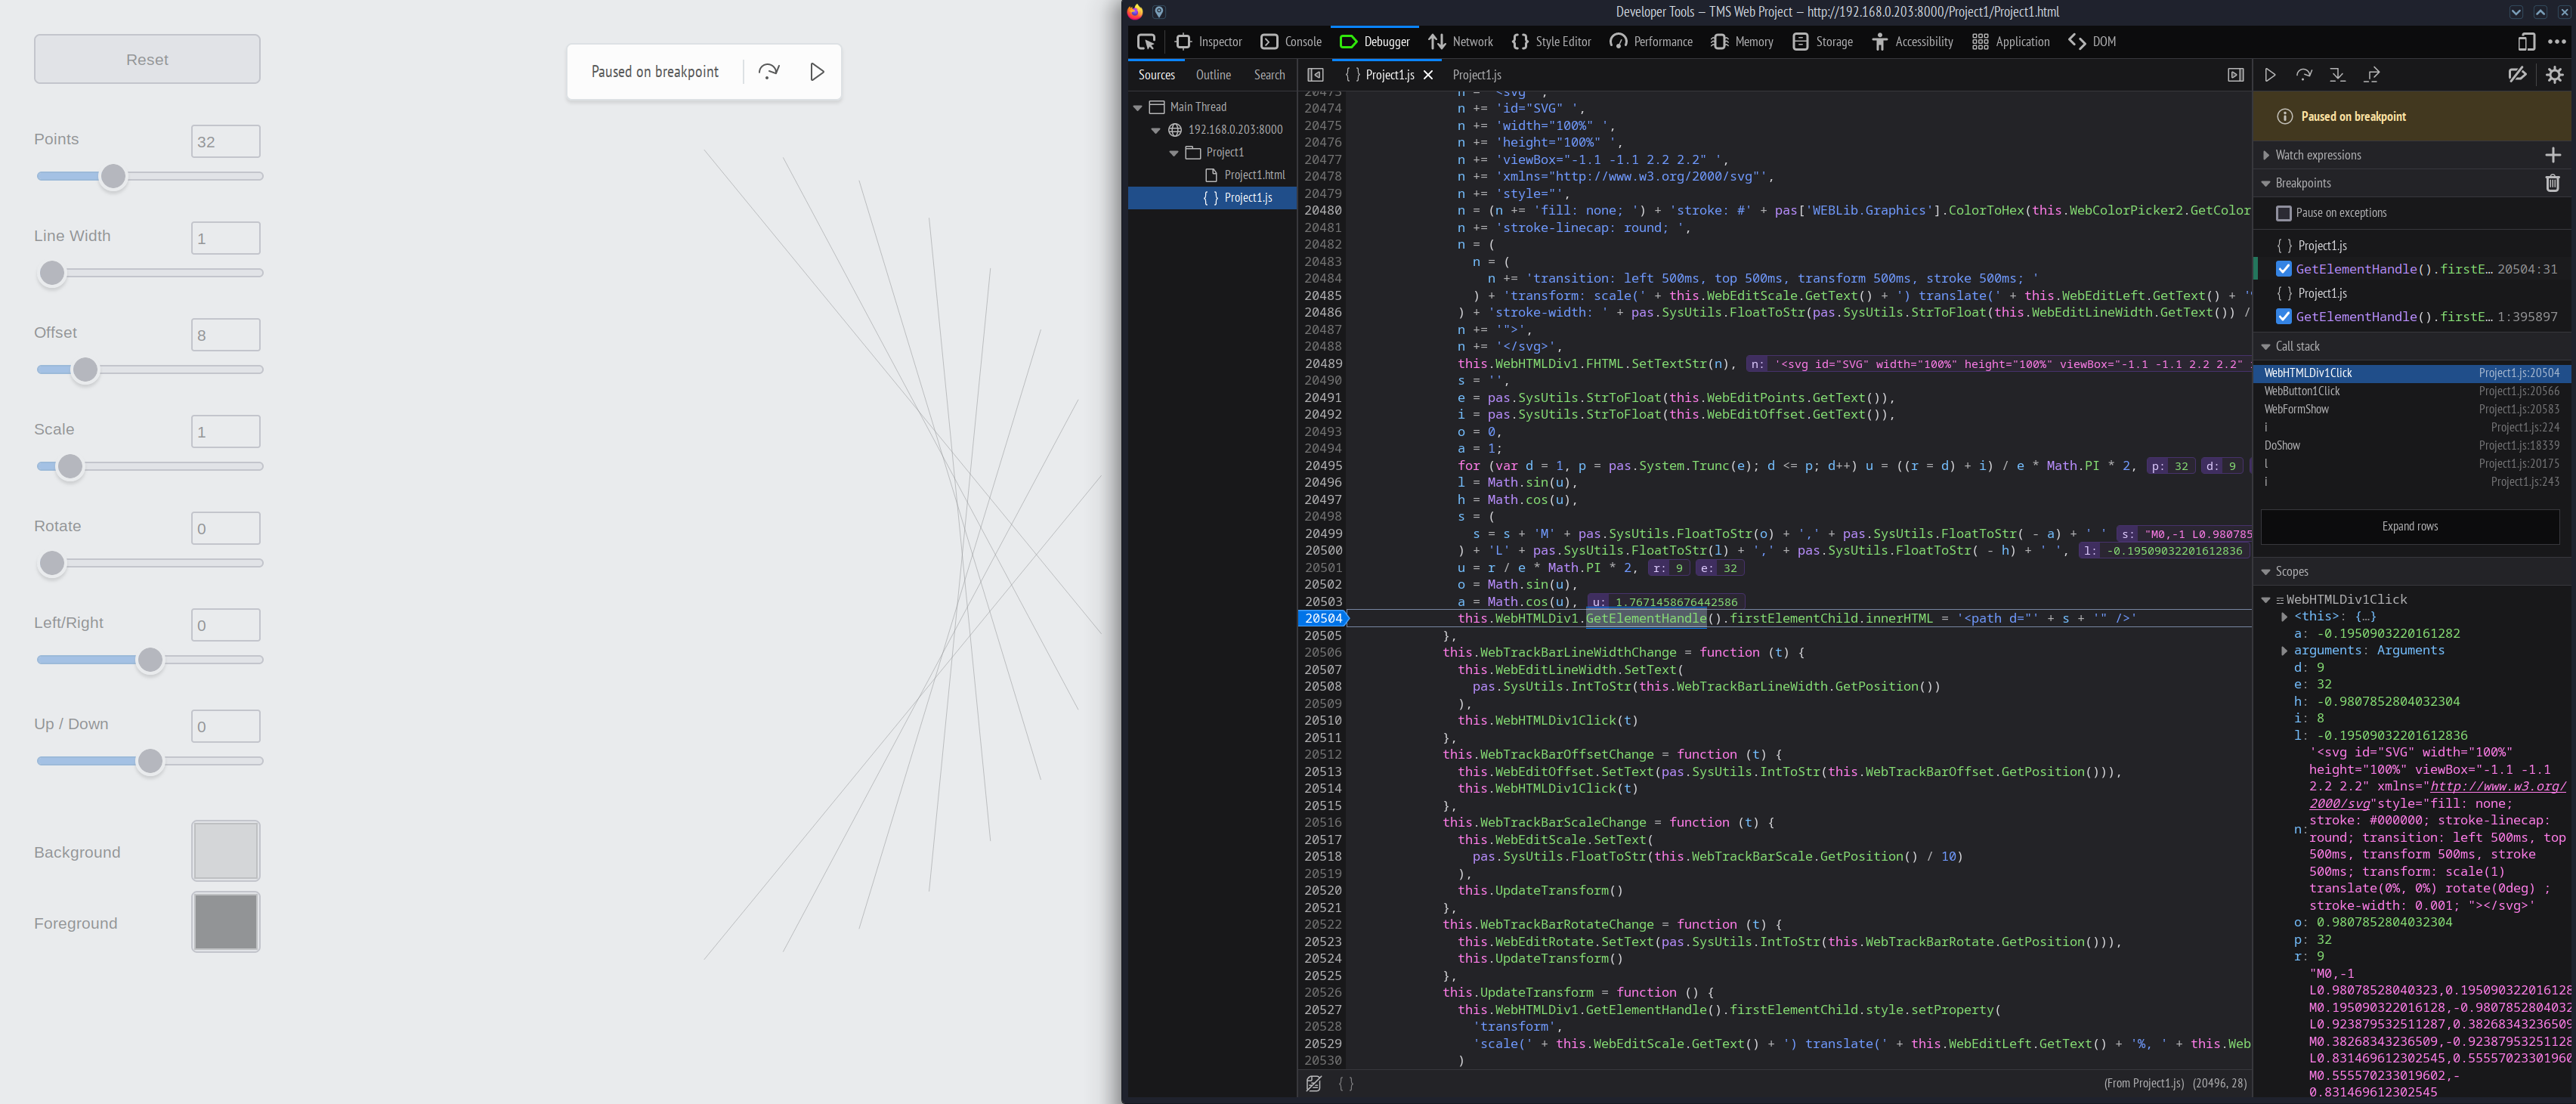
Same Project with Firefox DevTools.
So while our project might be successfully deployed using the Release version of our code, it isn't really any
more secure. This is perhaps one of the downsides of using JavaScript or really any scripting language. If the
code we're distributing is the script itself (as we're doing here) then there's not much that can be done to
keep the code or its running state hidden away. And, in many cases, this is not a bad thing. Just don't store
any secrets in your code. Under any circumstances.
All Debugged!
And that's our introduction to debugging a TMS WEB Core app. Being able to see our Delphi code directly in the browser DevTools window can greatly assist our troubleshooting efforts. There's always more to the story, however, so please post any comments, questions, or feedback as usual. Have you tried debugging one of your projects? What kinds of trouble did you get into?
The sample project is included here if you want to give it a try.
Download the project file
Related Posts:
Basics Part 1: Consoles, Calls, Classes, CSS, and... CAPS-LOCK?
Basics Part 2: Files, Fonts, Flex, and FNC
Basics Part 3: Attributes, Animation, Async, and Await
Basics Part 4: Images, Icons, iFrames, and Initialization
Basics Part 5: d, div, debugger, Debug, and Deployment
Basics Part 6: Links, Lists, Layouts, and Let
Follow Andrew on 𝕏 at @WebCoreAndMore or join our 𝕏 Web Core and More Community.
Andrew Simard

This blog post has not received any comments yet.
All Blog Posts | Next Post | Previous Post