Blog
All Blog Posts | Next Post | Previous Post

 TMS WEB Core v1.2 tips & tricks part 8: 3D Charts made easy
Friday, June 28, 2019
One of the big new features in TMS WEB Core v1.2 Padua is the built-in support for 3D graphics. This is accomplished by providing Object Pascal components and classes that wrap the powerful ThreeJS / WebGL libraries for rendering 3D graphics in the browser. This technology is meanwhile supported on every mainstream browser, including on mobile devices.As always, the goal of TMS WEB Core is to offer OO RAD Component based we development, so, integrating 3D graphics in your TMS WEB Core web client applications becomes a piece of cake. So, let's immediately jump to writing the code as an inspiration to get you started exploring the wonderful 3D web world.
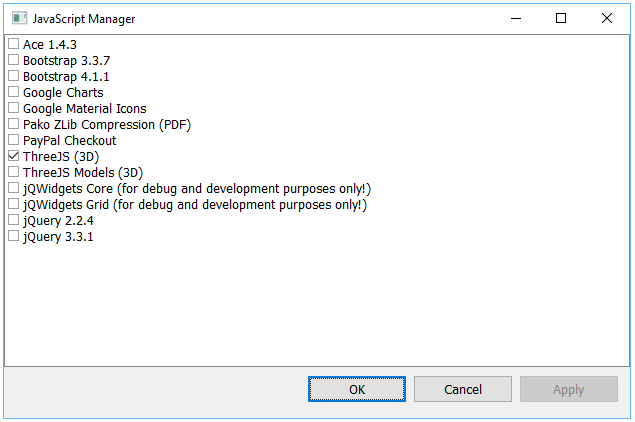
When interfacing with an existing JavaScript libraries is done from a TMS WEB Core application, we have made it equally easy to setup the link references to these libraries. In case of 3D we will need the ThreeJS library. So, from the project context menu in the Delphi IDE select "Manage JavaScript Libraries" and from there check to use ThreeJS.
Next, put a TWebThreeJSChart on the form and you can start defining series for your chart. Since climate change is a bit a "hot" topic (pun intended) in the last years everywhere, for our sample we got the idea to render the average month temperatures in Belgium (where our main TMS office is located) for the past 3 years. We got the data from a website that lists the temperature measurements since 1833. You can find the data here.
The series we want to display are a series with all months of the year and a series for years. A series is of the type TThreeJsChartSeries and is created with the X and Y axis labels via:
var
  aSeries: TThreeJsChartSeries;

begin
  aSeries := TThreeJsChartSeries.Create(
   TJSArray.New('Jan','Feb','Mar','Apr','May','Jun','Jul','Aug','Sep','Oct','Nov','Dec'),
   TJSArray.New('2017', '2018', '2019'));
end;Next, let's add values for each month for the 3 years to the series. This is done for a month via:
aSeries.addLegendRow('Jan', TJSArray.New(1.1, 6.0, 3.0));Other than this, all we need is to setup things like title, X-axis label, Y-axis label, Z-axis label, Z-axis maximum and step value and the formatting of the values along the Z-Axis. When this is ready, to display the series, we simply clear any possible previous series that were setup and then assign the series created and call WebThreeJsChart.createChart.
One more property available in a series is the property TThreeJsChartSeries.ChartType. The 3D chart supports following types: ctBarChart, ctCylinderChart, ctConeChart, ctLineChart, ctAreaChart.
The total code becomes:
procedure TForm1.InitChart(AType: TThreeJSChartType);
var
  aSeries: TThreeJsChartSeries;
begin
  aSeries := TThreeJsChartSeries.Create(
    TJSArray.New('Jan','Feb','Mar','Apr','May','Jun','Jul','Aug','Sep','Oct','Nov','Dec'),
    TJSArray.New('2017', '2018', '2019')
  );

  aSeries.addLegendRow('Jan', TJSArray.New(1.1, 6.0, 3.0));
  aSeries.addLegendRow('Feb', TJSArray.New(6.1, 0.8, 7.0));
  aSeries.addLegendRow('Mar', TJSArray.New(9.6, 5.4, 8.5));
  aSeries.addLegendRow('Apr', TJSArray.New(8.8, 13.0, 11.0));
  aSeries.addLegendRow('May', TJSArray.New(15.5, 16.3, 12.0));
  aSeries.addLegendRow('Jun', TJSArray.New(19.2, 18.1, 0));
  aSeries.addLegendRow('Jul', TJSArray.New(18.3, 22.0, 0));
  aSeries.addLegendRow('Aug', TJSArray.New(18.1, 19.4, 0));
  aSeries.addLegendRow('Sep', TJSArray.New(14.1, 15.4, 0));
  aSeries.addLegendRow('Oct', TJSArray.New(13.3, 12.6, 0));
  aSeries.addLegendRow('Nov', TJSArray.New(6.6, 7.4, 0));
  aSeries.addLegendRow('Dec', TJSArray.New(4.4, 5.8, 0));

  aSeries.valueAxisMarkMaximum := 30;
  aSeries.valueAxisMarkStep := 5;
  aSeries.ChartType := AType;
  aSeries.valueFormatFloat := '#,##0°C';
  aSeries.Title := 'Average month'#13#10'temperatures Belgium';
  aSeries.ValueAxisTitle := 'Temp';
  aSeries.LegendAxisTitle := 'Months';
  aSeries.CategoryAxisTitle := 'Year';

  WebThreeJsChart1.Series := aSeries;
  WebThreeJsChart1.clearChart;
  WebThreeJsChart1.createChart;
end;
Finally, we want to add one more additional tip and that is a frequently asked question how we can easily center a control in the browser window using pure Object Pascal code instead of what is in web development more commonly done using HTML/CSS. Well, the good news is that in Object Pascal this is also very easy. Add an event hanlder for Form.OnResize and write the code:
procedure TForm1.WebFormResize(Sender: TObject);
begin
  if WebThreeJsChart1.Width < Width then
  begin
    WebThreeJsChart1.Left := (Width - WebThreeJsChart1.Width) div 2;
  end;
end;
This results in the chart with the numbers we have till now, May 2019:
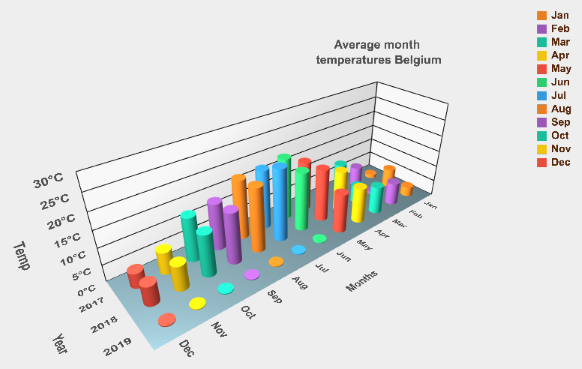
or better discover it live here
There is much more than doing just 3D charts with ThreeJS and TMS WEB Core, there are also samples for creating surface charts, show 3D model files or setup your own 3D scenes. Discover these and more exciting features in TMS WEB Core that let you create web client applications with unprecedented capabilities.
You can download the trial version, go ahead with the standalone version you purchased or with TMS WEB Core and additional tools that are all included in TMS ALL-ACCESS. Our team looks forward to all your comments, feedback, feature-requests to help steering the development of TMS WEB Core to the next stages!
Bruno Fierens

This blog post has received 2 comments.
 2. Saturday, June 29, 2019 at 8:38:28 AM
The X, Y zero point is the point where the Z-axis is.
2. Saturday, June 29, 2019 at 8:38:28 AM
The X, Y zero point is the point where the Z-axis is.
Bruno Fierens
All Blog Posts | Next Post | Previous Post
Richard King