Blog
All Blog Posts | Next Post | Previous Post

 From Sensor to Dashboard with StellarDS
Tuesday, June 9, 2026
One of the most rewarding parts of working with hardware is seeing real-world data come alive in software. A small sensor connected to single-board computer can tell us what is happening in the environment around it, but the data becomes much more useful when it is stored, shared, and visualized over time.
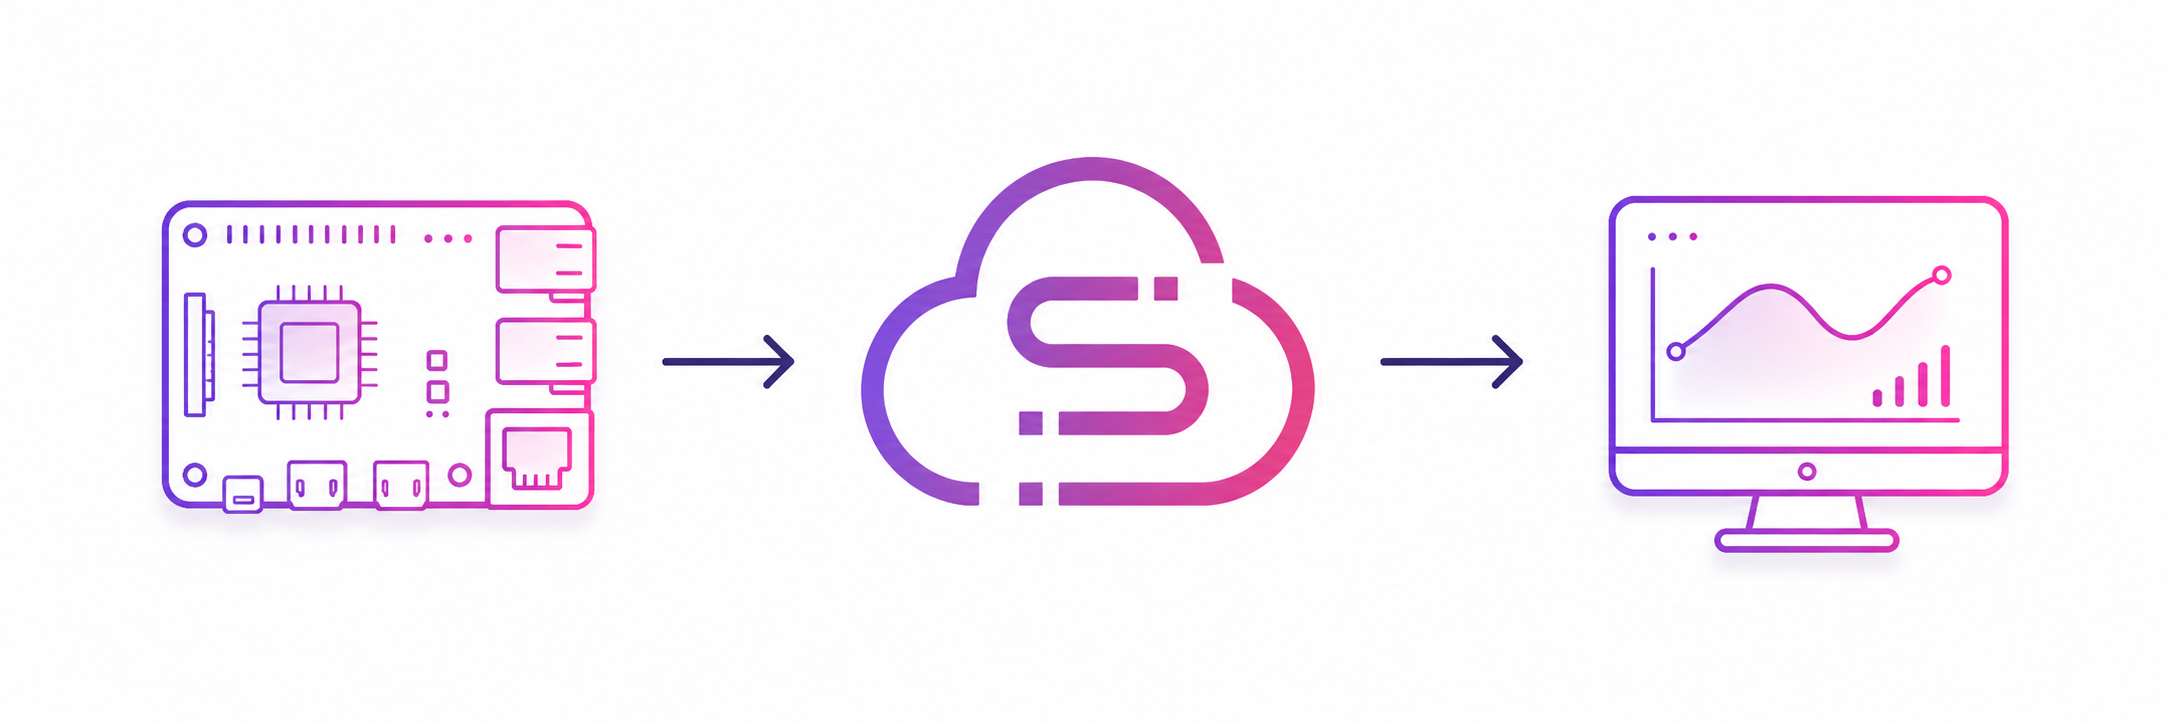
In this blog post, we'll create a simple temperature and air pressure logging application built around a Raspberry Pi and a BMP180 sensor. An application running on the Pi will periodically collect measurements and upload them to StellarDS, while a separate desktop dashboard application built with TMS FNC Chart will visualize the collected data. Together, these pieces form a complete end-to-end IoT solution!
The Glue: Why StellarDS?
Before diving into the hardware and software, let’s look at the piece that connects everything together.
The data logger application and the dashboard application could communicate in many different ways. We could build a custom REST service, host a database, configure networking, and maintain the infrastructure ourselves.
Instead, we will use StellarDS!
StellarDS is a cloud-hosted data platform that allows applications to store and retrieve data from anywhere. This means we can focus on building the application itself instead of maintaining backend infrastructure. In this project, StellarDS acts as the central hub: it receives measurements from the Raspberry Pi and makes them available to the dashboard application.
Connecting the Sensor
For the sensor, we will use a BMP180. The BMP180 is a popular and inexpensive sensor capable of measuring both temperature and air pressure. Communication happens over the I2C bus, so before running any software, make sure I2C is enabled on your Raspberry Pi.
Connect the sensor as follows:
| BMP180 | Raspberry Pi |
| VIN | 3.3V |
| GND | GND |
| SCL | GPIO 3 |
| SDA | GPIO 2 |
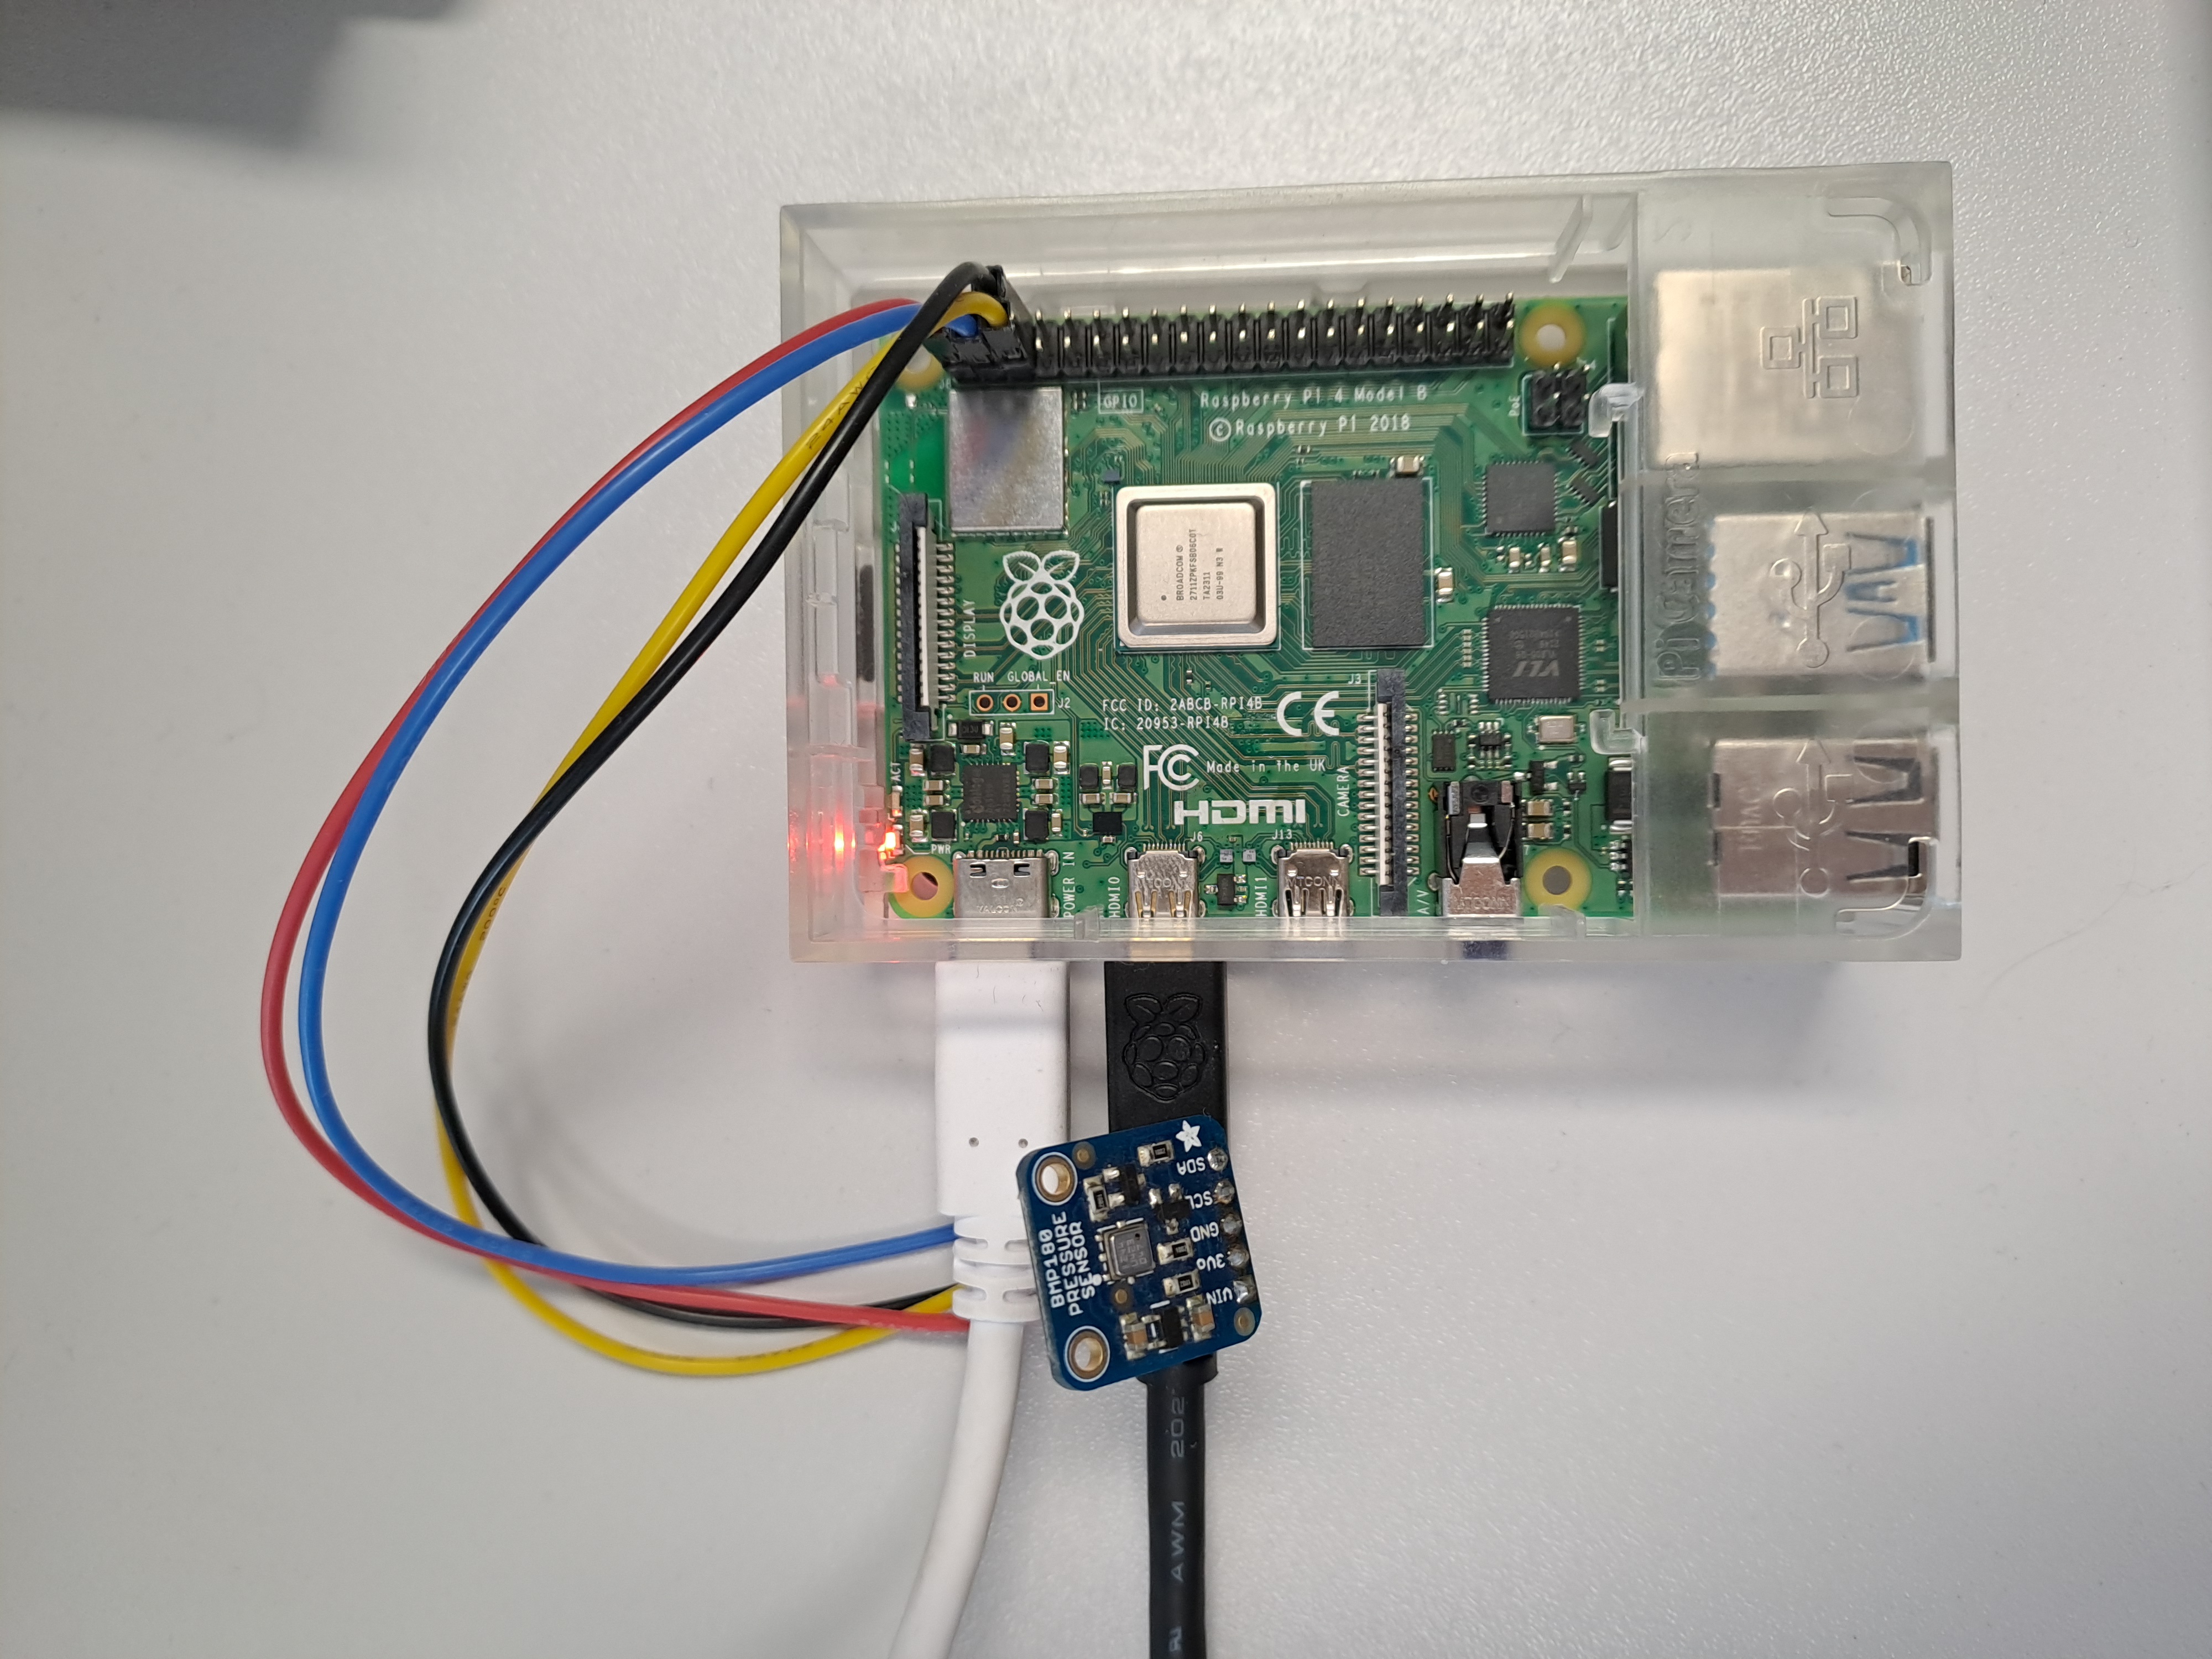 Once connected, we're ready to start collecting measurements!
The Data Logger Application
To log the sensor data from the BMP180, we will create a Lazarus application that runs directly on the Raspberry Pi.
We will use the free TMS LCL HW Pack for Raspberry Pi instead of implementing the sensor communication from scratch. This pack provides convenient access to hardware interfaces and sensors.
Let’s keep the flow simple.
1. Open the connection to the BMP180 sensor
The first step is to create the BMP180 sensor instance and open the connection.
procedure TForm1.FormCreate(Sender: TObject);
begin
bmp180 := TTMSLCLAdaBarTemp.Create(Self);
if bmp180.Open then
begin
//Init StellarDS instance
(...)
//Enable the "Connect" button
btConnect.Enabled := True;
end
else
ShowMessage('Cannot open the connection, please check the setup');
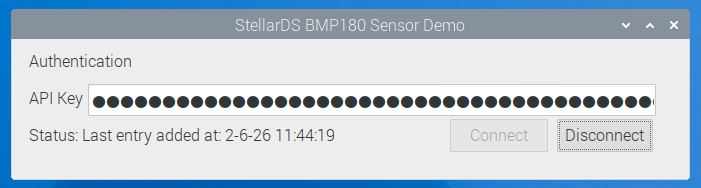
end;2. Connect to StellarDS using an API key
To make integration easier, this project includes a set of free-to-use units that encapsulate the required REST communication. These units can also be reused in your own Lazarus projects.
Creating the connection only requires a few lines of code:
procedure TForm1.btConnectClick(Sender: TObject);
begin
  TMSFNCCloudStellarDataStore1.Authentication.Key := edAPIKey.Text;
  TMSFNCCloudStellarDataStore1.Connect;
end;
Note: The API key needs read, write and create table permissions.
3. Create the destination table if it doesn't already exist
Once the connection is established, we check whether the data table already exists. If it does not, we create it and add the required metadata fields.
function TForm1.InitTable: Boolean;
var
  t: TTMSFNCCloudStellarDataStoreTable;
  mi: TTMSFNCCloudStellarDataStoreMetaDataItem;
  et: TTMSFNCCloudStellarDataStoreEntity;
begin
  Result := False;
  t := TMSFNCCloudStellarDataStore1.TableByName(cTABLENAME);
  if Assigned(t) then
    Result := True
  else
  begin
    TMSFNCCloudStellarDataStore1.Mode := moSync;
    t := TTMSFNCCloudStellarDataStoreTable.Create(TMSFNCCloudStellarDataStore1.Tables);
    t.Name := cTABLENAME;
    TMSFNCCloudStellarDataStore1.AddTable(t);

    TMSFNCCloudStellarDataStore1.TableId := t.ID;

    mi := TMSFNCCloudStellarDataStore1.MetaData.Add;
    mi.PropertyName := 'date';
    mi.DataType := ftDateTime;
    TMSFNCCloudStellarDataStore1.AddMetaData(mi);

    mi := TMSFNCCloudStellarDataStore1.MetaData.Add;
    mi.PropertyName := 'temperature';
    mi.DataType := ftFloat;
    TMSFNCCloudStellarDataStore1.AddMetaData(mi);

    mi := TMSFNCCloudStellarDataStore1.MetaData.Add;
    mi.PropertyName := 'pressure';
    mi.DataType := ftFloat;
    TMSFNCCloudStellarDataStore1.AddMetaData(mi);

    TMSFNCCloudStellarDataStore1.GetMetaData;
    TMSFNCCloudStellarDataStore1.Mode := moAsync;
  end;
end;
4. Start a timer and upload a new measurement every hour
When both the sensor and StellarDS connections are active, a timer can periodically read the sensor values and upload them to our table.
procedure TForm1.Timer1Timer(Sender: TObject);
var
  et: TTMSFNCCloudStellarDataStoreEntity;
begin
  et := TMSFNCCloudStellarDataStore1.Entities.Add;
  et.Values[cDATE] := Now;
  et.Values[cTEMPERATURE] := bmp180.GetTemperature;
  et.Values[cPRESSURE] := bmp180.GetPressure;

  TMSFNCCloudStellarDataStore1.Insert(et);
end;
At this point the Raspberry Pi is continuously feeding data into StellarDS!
The Viewer Application
Collecting data is only half the story. We also want an easy way to inspect and visualize the measurements.
For this, we will build a desktop dashboard application using FireMonkey. The dashboard uses TMS FNC Chart to present the measurements along with TMS FNC Cloud Pack to communicate with StellarDS through the TTMSFNCCloudStellarDataStore component.
1. Connecting to StellarDS
Using TMS FNC Cloud Pack, connecting to StellarDS is straightforward. The same API-key authentication used in the logger application can also be used here!
Alternatively, if one wants to authenticate with a Client ID and Secret:
StellarDataStore1.Authentication.ClientID := edClientID.Text;
StellarDataStore1.Authentication.Secret := edSecret.Text;
StellarDataStore1.Authentication.CallBackURL := edCallbackURL.Text;
StellarDataStore1.Connect;
After authentication, we can retrieve the available projects, tables, and metadata. From there, we can query the sensor data table and retrieve the historical measurements.
2. Populating the Chart
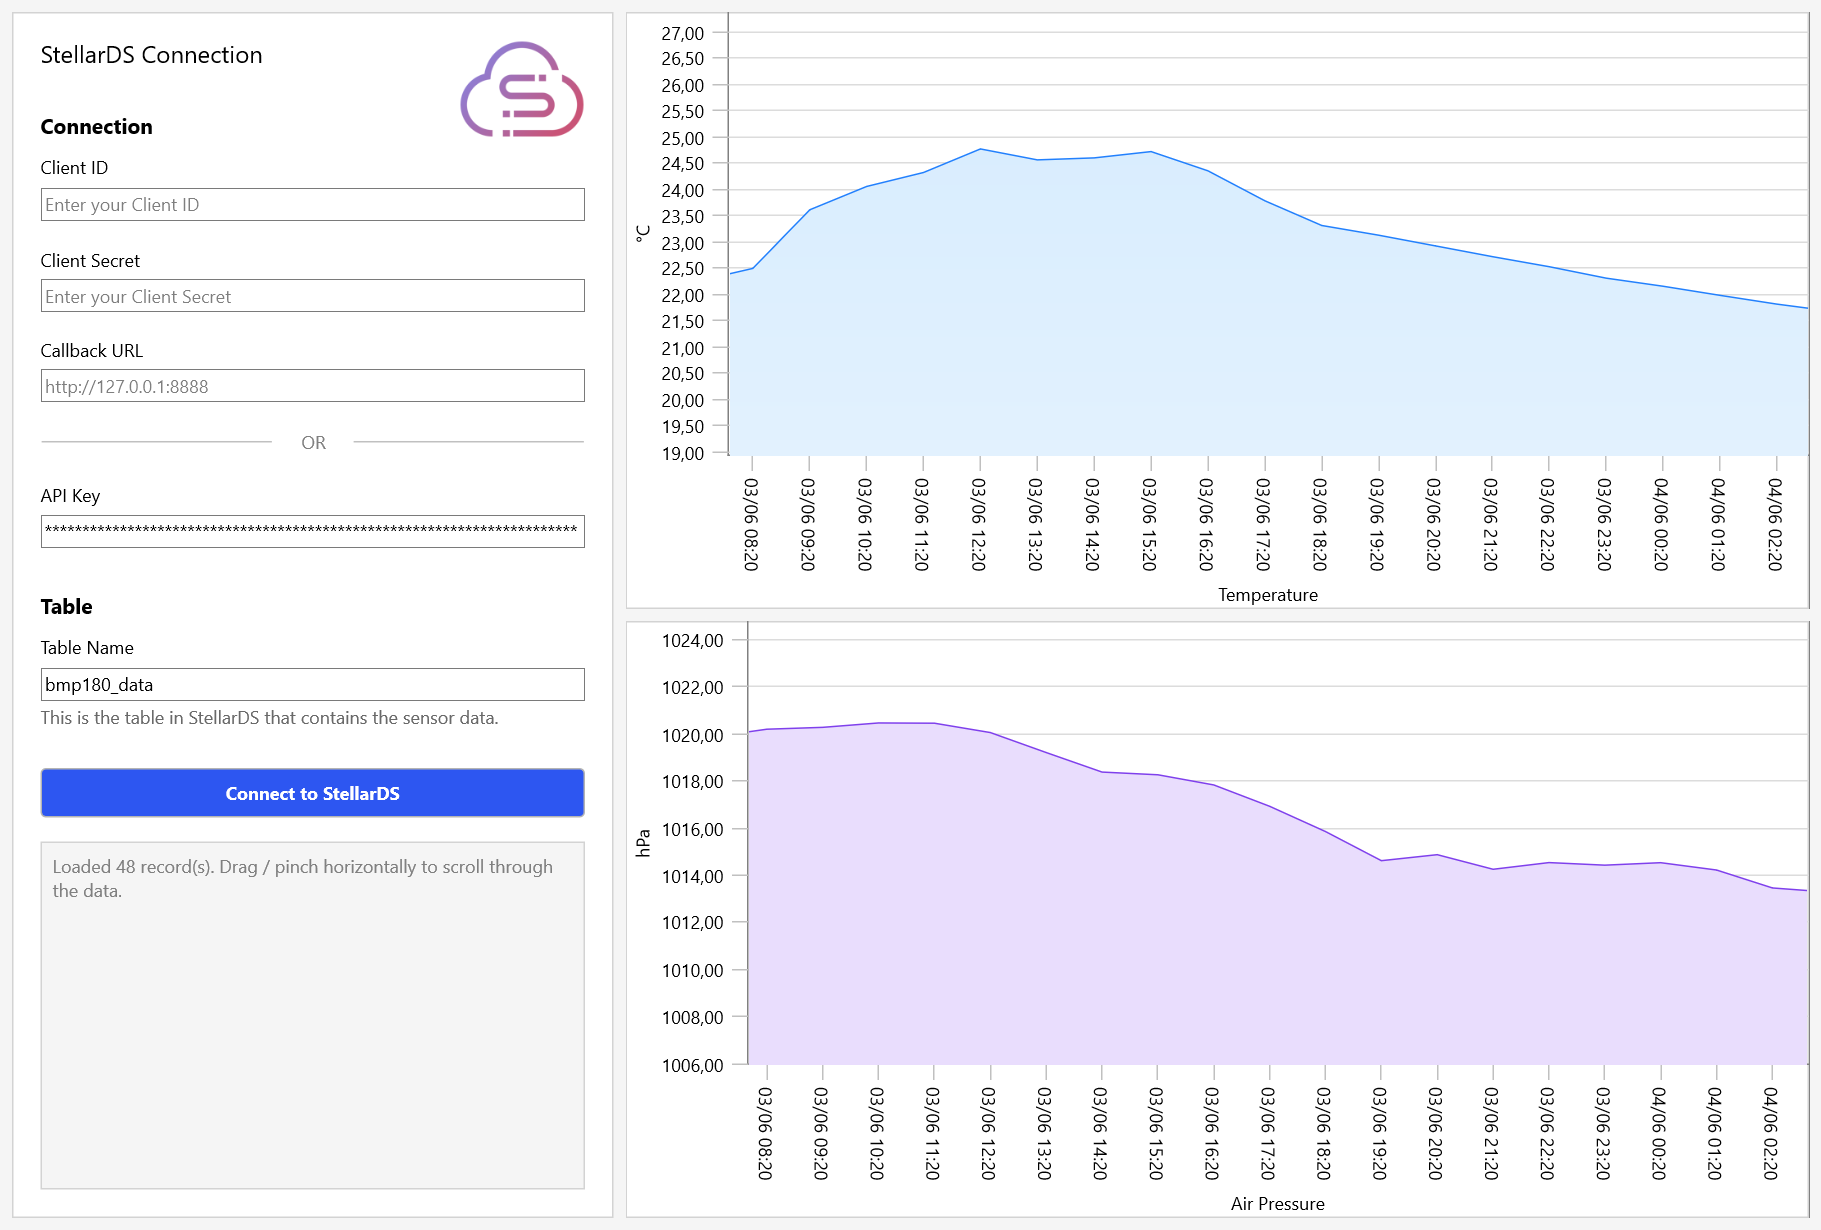
TMS FNC Chart makes it easy to create attractive visualizations with very little code. After retrieving the measurement records, we populate two charts: one for temperature and one for air pressure.
procedure TForm1.PopulateCharts(const AEntities: TTMSFNCCloudStellarDataStoreEntities);
var
  i: Integer;
  et: TTMSFNCCloudStellarDataStoreEntity;
  d, temp, pres: Double;
  sTemp, sPres: TTMSFNCChartSerie;
  xLabel: string;
begin
  chartTemp.BeginUpdate;
  chartPressure.BeginUpdate;
  try
    chartTemp.Clear;
    chartPressure.Clear;

    sTemp := chartTemp.Series.Add;
    sTemp.ChartType := ctArea;
    sTemp.XValues.Angle := 90;
    sTemp.XValues.Title.Text := 'Temperature';
    sTemp.YGrid.Visible := True;
    sTemp.YValues.Title.Text := Chr($00B0) + 'C';
    sTemp.Stroke.Color := $FF2280FD;
    sTemp.Fill.Color := $FFD9EDFE;
    sTemp.Fill.ColorTo := gcWhite;
    sTemp.Fill.Kind := gfkGradient;

    sPres := chartPressure.Series.Add;
    sPres.ChartType := ctArea;
    sPres.XValues.Angle := 90;
    sPres.XValues.Title.Text := 'Air Pressure';
    sPres.YGrid.Visible := True;
    sPres.YValues.Title.Text := 'hPa';
    sPres.Stroke.Color := $FF7F40EC;
    sPres.Fill.Color := $FFE9DDFD;
    sPres.Fill.ColorTo := gcWhite;
    sPres.Fill.Kind := gfkGradient;

    for i := 0 to AEntities.Count - 1 do
    begin
      et := AEntities[i];
      if not TryEntityFloat(et, FIELD_DATE, d) then
        Continue;

      xLabel := FormatDateTime('dd/mm hh:nn', d);

      if TryEntityFloat(et, FIELD_TEMPERATURE, temp) then
        sTemp.AddPoint(temp, xLabel);
      if TryEntityFloat(et, FIELD_PRESSURE, pres) then
        sPres.AddPoint(pres, xLabel);
    end;
  finally
    chartTemp.EndUpdate;
    chartPressure.EndUpdate;
  end;
end;
The resulting dashboard provides a clear overview of temperature and pressure changes over time!
Because the data resides in StellarDS, the dashboard can run on a completely different machine than the Raspberry Pi. As long as both applications have internet access, they can share the same dataset!
Download the Full Project
The full source code for this project is available for download, including both the Raspberry Pi data logger application and the FireMonkey viewer application.
A compiled version of the viewer application is also included, so you can quickly connect it to your own StellarDS account and start exploring your collected sensor data!
Click here to download!
Conclusion
From a small sensor connected to a Raspberry Pi, we created a complete flow for collecting, storing, and visualizing environmental data.
StellarDS makes the collected measurements available beyond the Raspberry Pi itself, while TMS FNC Chart turns the stored values into an easy-to-read dashboard. Together, they provide a practical foundation for building IoT applications where data needs to be accessible, understandable, and ready to grow with the project.
Tunde Keller

This blog post has not received any comments yet.
All Blog Posts | Next Post | Previous Post