Blog
All Blog Posts | Next Post | Previous Post

 TMS Web Core and More with Andrew:
Working with Home Assistant - Part 7: Weather
Friday, March 24, 2023

In our last Home Assistant post, Part
6, we had a look at how to incorporate climate data into our Catheedral
app - a TMS
WEB Core project built using the Miletus
framework. In this context, climate data refers primarily to temperature, humidity, and light data inside
the home or office environment. In this instalment, we're going to have a look at weather data - local temperature,
humidity, and other data outside the home or office environment. This data is used to populate the third panel
of our Catheedral
home page. We'll have a look at how to deal with different sources of data, and data that is perhaps less
reliable than we might expect it to be.
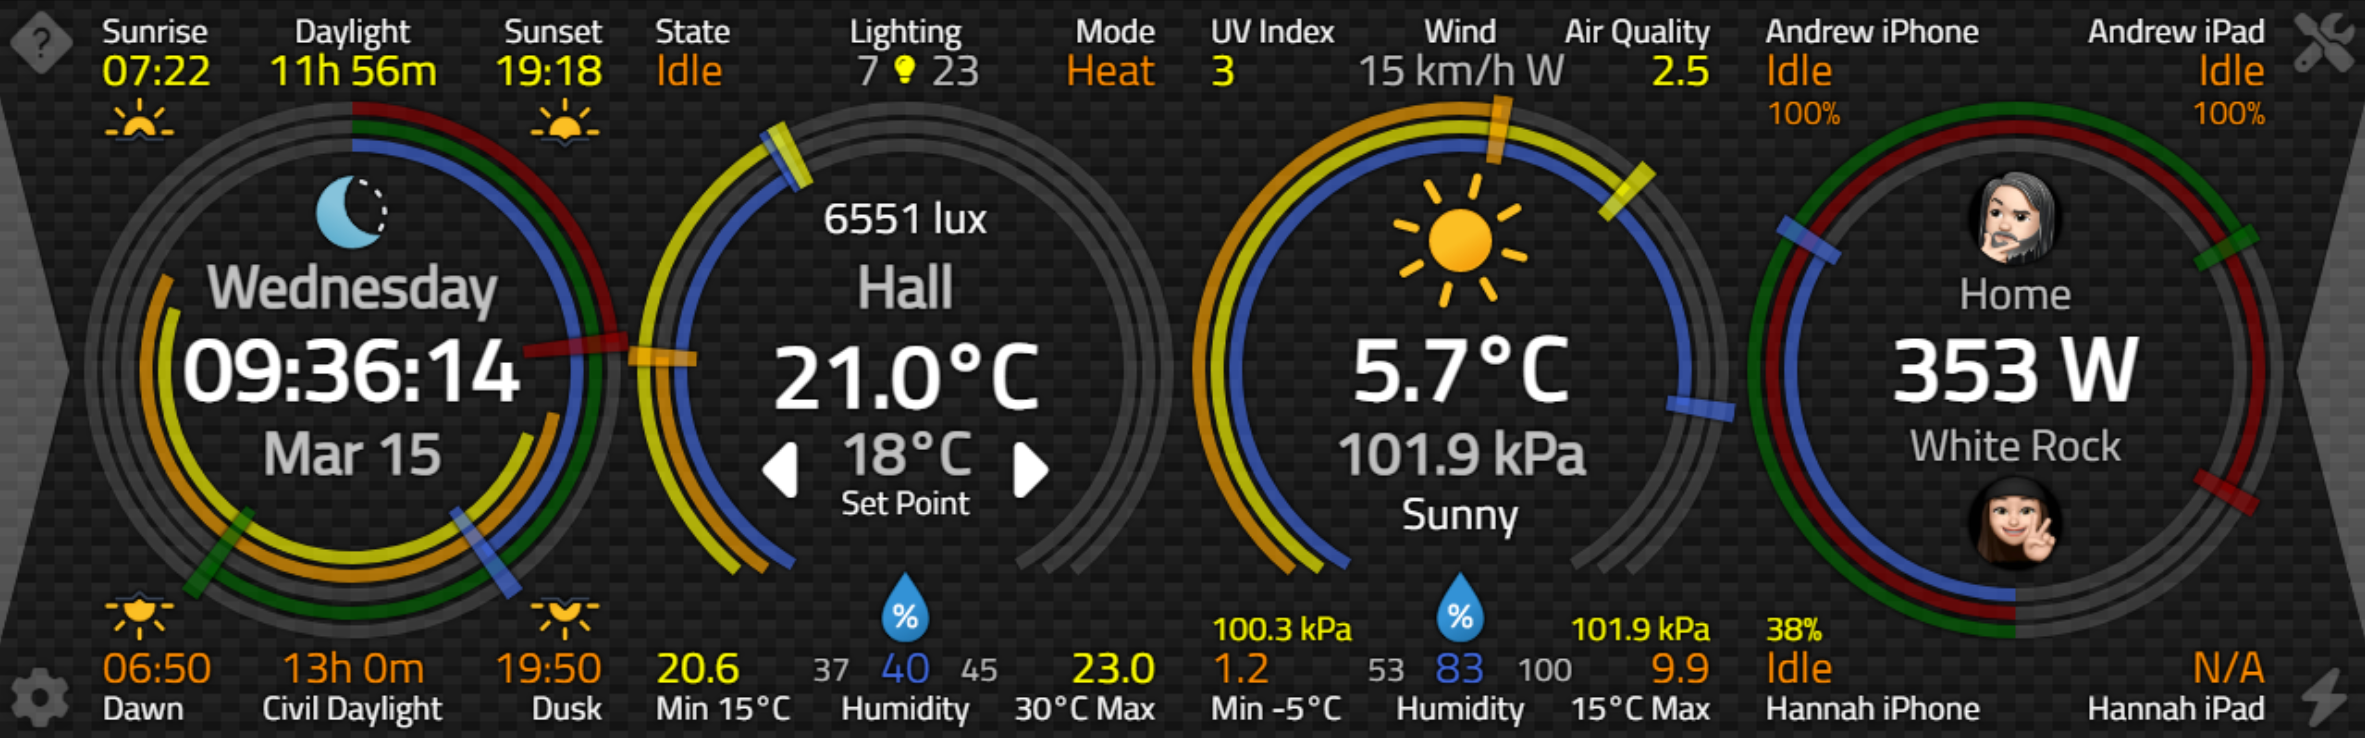
Catheedral App - Weather Data is found in the Third Panel.
Weather Data Sources.
One of the reasons we're interested in Home Assistant when working on TMS WEB Core projects is because it can be a repository for a very broad range of information, all accessible in one package. An extensive and evolving suite of plugins and "Integrations" means that there are new and novel bits of data made available to Home Assistant on a regular basis. In addition, the Home Assistant community is equally extensive and responsive, with new projects coming online all the time, bringing interfaces to all kinds of data from all over the world. And weather data is no exception here. There are numerous sources of weather data and numerous ways to manage and display that data within Home Assistant. All sounds good, right?
Well, it is good, honestly, but there are a few things to be wary of. First, depending on where you are, the coverage available for any given weather data source may vary from fantastic to non-existent. And second, weather data sources themselves may offer an array of current and forecast data points, or they may offer very few. We're going to have an in-depth look at two data sources and see how this plays out. Depending on your location, it may very well be that further coding is required to get the most from your local weather data source, so we'll have a look at what might be involved in that scenario as well.
Often, the best weather data source for a given location is supplied by whatever the local senior government agency happens to be. In Canada, this is managed by our federal ministry, Environment Canada. In the United States, this might be NOAA. In the UK, perhaps the Met Office is the definitive source. In Australia, maybe it is the BOM. There are also many quite useful non-government weather data sources, such as AccuWeather and OpenWeatherMap.
Each of these sources has integrations available for Home Assistant. And each
has its own way of reporting data which, as one might expect, flow into a common set of Home Assistant
entities. Sometimes these work well enough that a generic Home Assistant "Weather Card" can pick up the data
and display something useful. Sometimes more than one card is needed to get at details that might not be common
across all weather data sources. It is always possible to get at whatever data is supplied by a weather data
source, no matter the detail or format, but this may involve a bit more work on the Home Assistant side. For example, by displaying entities that are not covered by the existing Weather Card using other more generic cards, or using cards specifically tailored to a given data source.
Another thing to be aware of is that, while most of the time this data comes free of charge, there is often a requirement to register with the weather data provider, where they provide you with an API key. This API key is typically rate-limited so that you can perform, for example, 1,000 requests per day for free. The idea is often that you can use their API for free for one installation, but if you're wanting to incorporate their data into a widely distributed app, then fees (usually very small) will apply. Sometimes, as in the case with AccuWeather, for example, there may be multiple APIs and various key formats, and the Home Assistant integration may not always keep up with the changes or support all of the different APIs. Something to be mindful of.
And one final thing before we dive in. Weather data sources are not always in agreement with one another. Even though you might have two weather data sources supplying detailed information about a given location, they may very well report different results. Some providers simply report observations from local government weather stations. Others may provide data based on interpolated data from those very same weather stations.
For
example, if a weather station only reports a temperature twice per day, one provider might report just those
observations. Another provider might instead choose to provide hourly temperatures for the rest of the day,
filling in the blanks with their own calculated estimates. In my location (Vancouver, British
Columbia, Canada), the most commonly used weather station can be found at our local airport - YVR. This is
generally a more southwestern point in our region, adjacent to a very large body of water. Where conditions
can be very different from other in-land locations across the rest of Metro Vancouver. Here's what we've got
from Environment Canada at the moment.
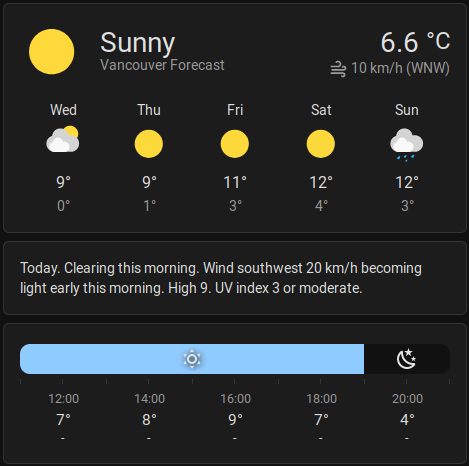
Environment Canada Weather Data.
There's lots of data here, but it takes three different Home Assistant cards to get at it all. Using
OpenWeatherMap, we can get a similar result but with more variance in the data than might be expected.
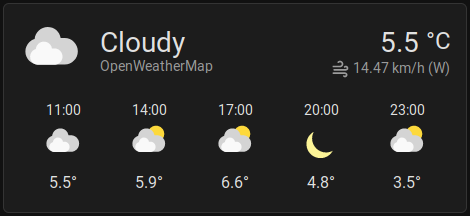
OpenWeatherMap Weather Data.
To be fair, substantially more time has been spent fiddling with the Environment Canada display than the
OpenWeatherMap display, but the same Home Assistant card is used in both examples. In one case, the forecast
covers several days, while in the other, with the same configuration options selected, the forecast covers
several hours. As far as whether it is sunny or cloudy today, well, I'd be more inclined to agree with
Environment Canada here.

Current Observation.
Unfortunately, weather data can be somewhat subjective at times. Where is the line drawn between sunny, partly cloudy, and cloudy? Well, I'm sure there are solid definitions used by those reporting these kinds of observations, but I somehow doubt that the same definitions are used by everyone, even in the same region. This isn't unexpected, of course, just the reality of dealing with disparities between regions and data providers. For example, there is a list of terms used by Environment Canada for just this sort of thing that has been used in developing the Home Assistant integration, which can be found here.
https://github.com/home-assistant/core/blob/dev/homeassistant/components/environment_canada/weather.py
This would not be all that useful in many other regions of the world, particularly as there's no mention of conditions like "tornado" or "hurricane" that, unfortunately, many other regions have to deal with far more frequently. And this is the source of our problem today - planning for data where the format is likely to be less structured than we'd like. This means, most likely, that anything we can come up with for one source of weather data will likely have to be, at the very least, adjusted for another weather source.
We already have a mechanism for dealing with this kind of thing, which we used in our last post. Creating new
Home Assistant entities. And we'll need to do that here as well, as we again find ourselves in a situation
where historical data is available but not presented in a particularly convenient way. So, before we get any
further, let's sort out one data source and see what we have to work with. We'll then adapt whatever we end
up with to other data sources.
Environment Canada Data.
Let's start here. It seems to have all the data that we're interested in, and doesn't require an API key. Of
course, this is likely to be useful only for locations in Canada. Internally, the data flows into a few Home
Assistant sensors. We can see their contents from within Home Assistant using the developer tools built
into Home Assistant. But we can also see their contents by looking at the JSON coming over from Home Assistant into our Catheedral ap. There are more than 30 different entities listed. Here's one showing the current conditions. Usually what
we're after is the name of the entity (the "entity_id" value in the JSON) as well as the value for that entity
(the "state" value in the JSON).
{
    "entity_id": "sensor.vancouver_current_condition",
    "state": "Mainly Sunny",
    "attributes": {
        "location": "Vancouver",
        "station": "Vancouver Int'l Airport",
        "attribution": "Data provided by Environment Canada",
        "friendly_name": "Vancouver Current condition"
    },
    "last_changed": "2023-03-15T18:12:40.641976+00:00",
    "last_updated": "2023-03-15T18:12:40.641976+00:00",
    "context": {
        "id": "01GVK7JS21Q9T14Z6WEJB9GP3V",
        "parent_id": null,
        "user_id": null
    }
}
With so many different entities, it can take a bit of effort to sort out what we want to display in our interface. Some entities combine quite a lot of information into one set of attributes, so let's see if we can use one of those. The "weather.vancouver_forecaset" entity seems to be a solid place to start.
{
    "entity_id": "weather.vancouver_forecast",
    "state": "sunny",
    "attributes": {
        "temperature": 7.5,
        "temperature_unit": "°C",
        "humidity": 71,
        "pressure": 1022,
        "pressure_unit": "hPa",
        "wind_bearing": 233,
        "wind_speed": 14,
        "wind_speed_unit": "km/h",
        "visibility": 48.3,
        "visibility_unit": "km",
        "precipitation_unit": "mm",
        "forecast": [
            {
                "datetime": "2023-03-15T12:07:40.653164-07:00",
                "condition": "sunny",
                "precipitation_probability": 0,
                "temperature": 9,
                "templow": 0
            },
            {
                "datetime": "2023-03-16T12:07:40.653171-07:00",
                "condition": "sunny",
                "precipitation_probability": 0,
                "temperature": 9,
                "templow": 1
            },
            {
                "datetime": "2023-03-17T12:07:40.653176-07:00",
                "condition": "sunny",
                "precipitation_probability": 0,
                "temperature": 11,
                "templow": 3
            },
            {
                "datetime": "2023-03-18T12:07:40.653182-07:00",
                "condition": "sunny",
                "precipitation_probability": 0,
                "temperature": 12,
                "templow": 4
            },
            {
                "datetime": "2023-03-19T12:07:40.653187-07:00",
                "condition": "rainy",
                "precipitation_probability": 60,
                "temperature": 12,
                "templow": 3
            },
            {
                "datetime": "2023-03-20T12:07:40.653193-07:00",
                "condition": "rainy",
                "precipitation_probability": 60,
                "temperature": 10,
                "templow": 2
            }
        ],
        "attribution": "Data provided by Environment Canada",
        "friendly_name": "Vancouver Forecast"
    },
    "last_changed": "2023-03-15T18:12:40.644220+00:00",
    "last_updated": "2023-03-15T19:07:40.653262+00:00",
    "context": {
        "id": "01GVKAQFQDYANJE01CRKE3WEBR",
        "parent_id": null,
        "user_id": null
    }
}
We'll ignore the daily forecast part for the moment and focus on the current conditions. Initially, we're primarily interested in the temperature, pressure, and humidity numbers, but we can also get the current state ("Sunny") and wind information from here. In order to update our "ring" interface, we'll also be interested in knowing what the recent past values have been, specifically for temperature, pressure, and humidity. We can create new entities in Home Assistant for this using their Statistics mechanism, just by adding entries to the "configuration.yaml" file as we've done before with the climate data.
  - platform: template
    sensors:
      weather_current_temperature:
        friendly_name: 'Weather Current Temperature'
        value_template: '{{ state_attr("weather.vancouver_forecast", "temperature") }}'

  - platform: template
    sensors:
      weather_current_pressure:
        friendly_name: 'Weather Current Pressure'
        value_template: '{{ state_attr("weather.vancouver_forecast", "pressure") }}'

  - platform: template
    sensors:
      weather_current_humidity:
        friendly_name: 'Weather Current Humidity'
        value_template: '{{ state_attr("weather.vancouver_forecast", "humidity") }}'

  - platform: statistics
    name: "Weather Maximum Temperature"
    entity_id: sensor.weather_current_temperature
    state_characteristic: value_max
    max_age:
      hours: 48
    sampling_size: 576

  - platform: statistics
    name: "Weather Minimum Temperature"
    entity_id: sensor.weather_current_temperature
    state_characteristic: value_min
    max_age:
      hours: 48
    sampling_size: 576

  - platform: statistics
    name: "Weather Maximum Pressure"
    entity_id: sensor.weather_current_pressure
    state_characteristic: value_max
    max_age:
      hours: 48
    sampling_size: 576

  - platform: statistics
    name: "Weather Minimum Pressure"
    entity_id: sensor.weather_current_pressure
    state_characteristic: value_min
    max_age:
      hours: 48
    sampling_size: 576

  - platform: statistics
    name: "Weather Maximum humidity"
    entity_id: sensor.weather_current_humidity
    state_characteristic: value_max
    max_age:
      hours: 48
    sampling_size: 576

  - platform: statistics
    name: "Weather Minimum Humidity"
    entity_id: sensor.weather_current_humidity
    state_characteristic: value_min
    max_age:
      hours: 48
    sampling_size: 576
Here, we're taking attributes from the weather.vancouver_forecast entity and setting up historical values (over the past 48 hours) for their minimums and maximums. We can then get at these entities separately, keeping in mind that when the Home Assistant server restarts, they may be unavailable for a short period of time. If we were to change the source of our weather data, we'd need to update these statistics accordingly, but we wouldn't need to change them in our app.
And speaking of which, we'll need to tell our app which entities we're
interested in "plucking" out of the data stream that Home Assistant sends our way. We've done this a couple of
times already. While we're getting these values, we can also pick up a couple of others at the same time, such
as the UV Index and Air Quality Index values that are also available from this set of data.
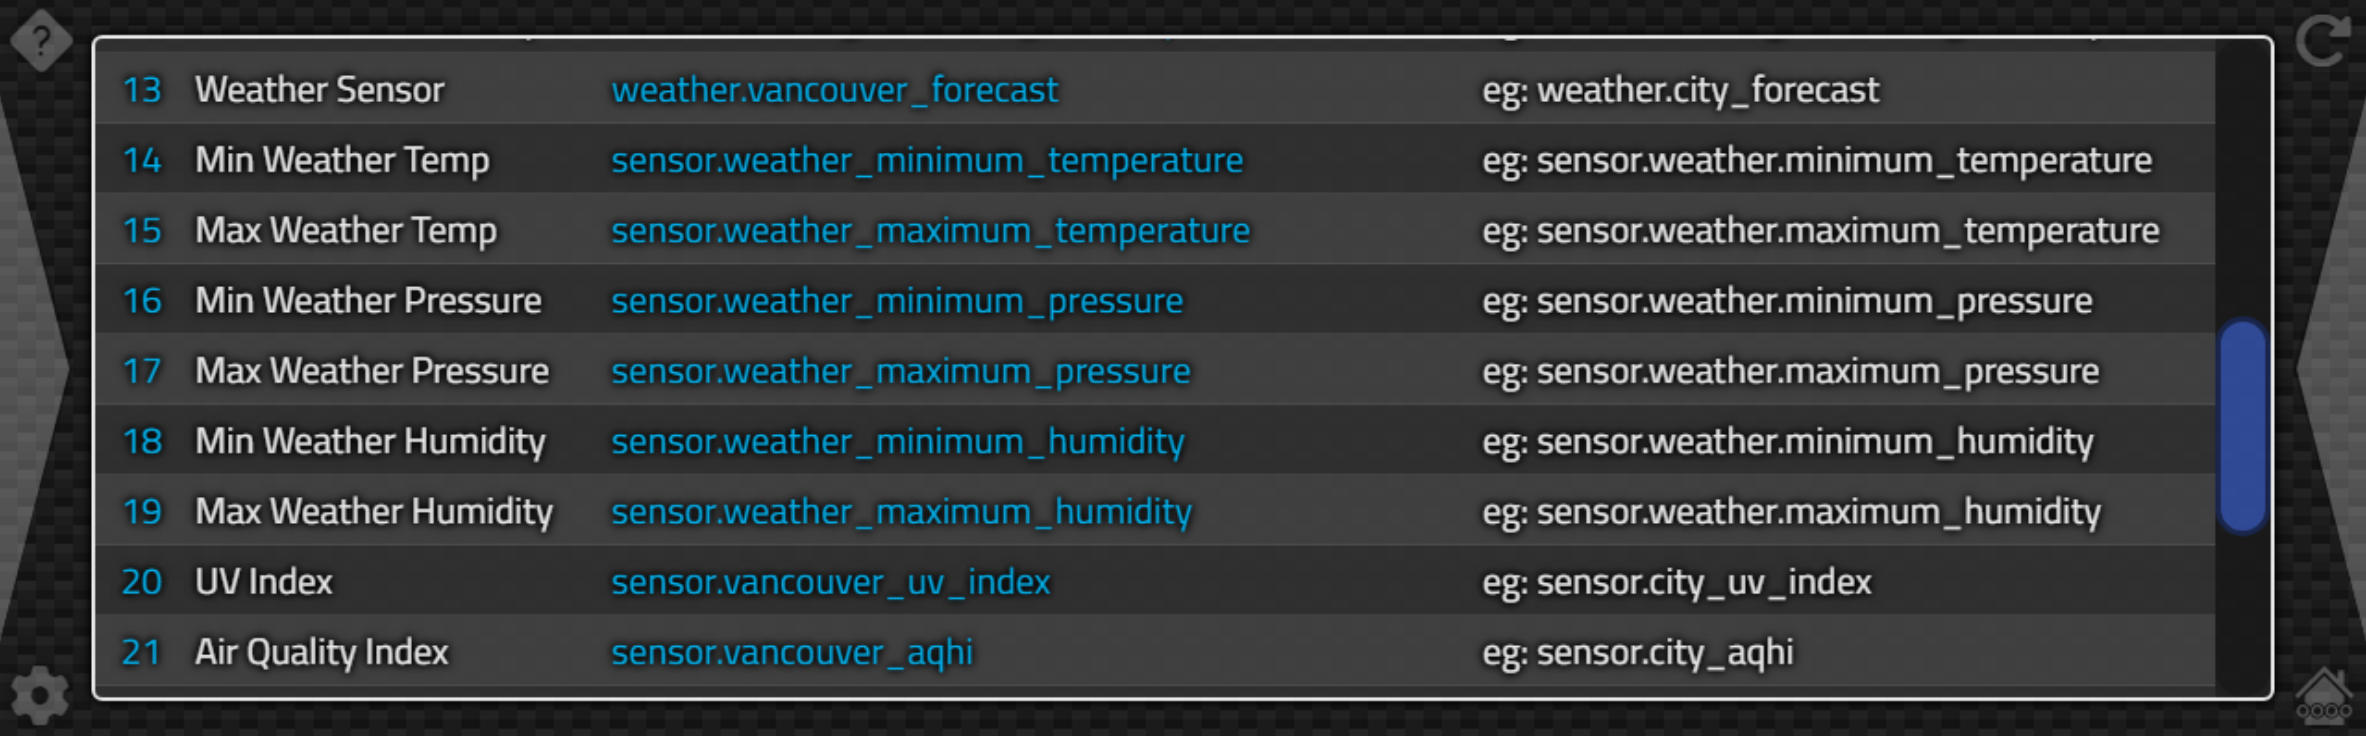
Configuring Weather-related Sensor Links.
With these in place, we then have to parse the data that comes across, to extract what we need for the
Catheedral home page. Here, as we've been doing previously, we'll set up an assortment of form variables to
hold the bits of data, so that we can just display it when needed. Then, if there's any kind of data outage,
we'll still have what we need to update our display, even if it is a little out of date.
    WeatherIcon: String;
    WeatherCondition: String;
    WeatherWind: String;
    WeatherTemperature: Double;
    WeatherHumidity: Double;
    WeatherPressure: Double;
    WeatherPressureUnit: String;
    WeatherMinTemp: Double;
    WeatherMaxTemp: Double;
    WeatherMinPressure: Double;
    WeatherMaxPressure: Double;
    WeatherMinHumidity: Double;
    WeatherMaxHumidity: Double;
    WeatherMinTempRange: Double;
    WeatherMaxTempRange: Double;
    WeatherMinPressureRange: Double;
    WeatherMaxPressureRange: Double;
    WeatherUV: String;
    WeatherAQHI: String;
To populate these values, we'll use our StateChanged method as we've been doing previously. There is the main entity that we'll extract values from, as well as a handful of entities where we just need one individual state value. All JavaScript here, primarily because it is easier (for this developer, anyway!) to deal with processing JSON.
  else if (Entity = WeatherSensor) then
  begin
    asm
      this.WeatherTemperature = parseFloat(State.attributes.temperature) || 0;
      this.WeatherPressure = parseFloat(State.attributes.pressure) || 0;
      this.WeatherHumidity = parseFloat(State.attributes.humidity) || 0;
      this.WeatherPressureUnit = parseFloat(State.attributes.pressure_unit) || 0;
      this.WeatherCondition = window.CapWords(State.state || 'N/A');

      var wind_bearing = parseInt(State.attributes.wind_bearing) || 0;
      var wind_heading = Math.round(((wind_bearing %= 360) < 0 ? wind_bearing + 360 : wind_bearing) / 22.5) % 16;
      var headings = ['N','NNE','NE','ENE','E','ESE','SE','SSE','S','SWS','SW','WSW','W','WNW','NW','NWW'];
      this.WeatherWind = State.attributes.wind_speed+' '+State.attributes.wind_speed_unit+' '+headings[wind_heading];
    end;

    WeatherIcon := 'not-available';

    // Environment Canada Contitions - other data sources may be very different!!
    // https://github.com/home-assistant/core/blob/dev/homeassistant/components/environment_canada/weather.py
    if WeatherCondition = 'Partlycloudy' then WeatherCondition := 'Partly Cloudy';
    if WeatherCondition = 'Clear-night' then WeatherCondition := 'Clear Night';
    if WeatherCondition = 'Snowy-rainy' then WeatherCondition := 'Snowy Rainy';

    // These are the ones we know about!
    if      WeatherCondition = 'Sunny' then WeatherIcon := 'clear-day'
    else if WeatherCondition = 'Clear Night' then WeatherIcon := 'clear-night'
    else if WeatherCondition = 'Partly Cloudy' then WeatherIcon := 'partly-cloudy-day'
    else if WeatherCondition = 'Cloudy' then WeatherIcon := 'cloudy'
    else if WeatherCondition = 'Rainy' then WeatherIcon := 'rain'
    else if WeatherCondition = 'Lightning Rainy' then WeatherIcon := 'thunderstorms-rain'
    else if WeatherCondition = 'Pouring' then WeatherIcon := 'extreme-rain'
    else if WeatherCondition = 'Snowy Rainy' then WeatherIcon := 'extreme-snow'
    else if WeatherCondition = 'Snowy' then WeatherIcon := 'snow'
    else if WeatherCondition = 'Windy' then WeatherIcon := 'wind'
    else if WeatherCondition = 'Fog' then WeatherIcon := 'fog'
    else if WeatherCondition = 'Hail' then WeatherIcon := 'hail'
  end

  else if (Entity = WeatherMinTempSensor) then asm if (!isNaN(State.state)) { this.WeatherMinTemp = parseFloat(State.state) } end
  else if (Entity = WeatherMaxTempSensor) then asm if (!isNaN(State.state)) { this.WeatherMaxTemp = parseFloat(State.state) } end
  else if (Entity = WeatherMinPressureSensor) then asm if (!isNaN(State.state)) { this.WeatherMinPressure = parseFloat(State.state) } end
  else if (Entity = WeatherMaxPressureSensor) then asm if (!isNaN(State.state)) { this.WeatherMaxPressure = parseFloat(State.state) }end
  else if (Entity = WeatherMinHumiditySensor) then asm this.WeatherMinHumidity = parseFloat(State.state) end
  else if (Entity = WeatherMaxHumiditySensor) then asm this.WeatherMaxHumidity = parseFloat(State.state) end
  else if (Entity = WeatherUVSensor) then asm this.WeatherUV = State.state end
  else if (Entity = WeatherAQHISensor) then asm this.WeatherAQHI = State.state end
This follows the same approach we've been using, but there are a few concepts here worth pointing out.
- In JavaScript, an expression like expression || 0 is used to assign a default value where an expression is null. We'll use this often in situations where data might not always be available.
- The parseFloat() function is used to ensure the value is numeric and not "N/A" or something like that.
- Probably worth the effort to try and understand how the wind heading value is calculated. JavaScript folks like to do things in cryptic shorthand, and this is a solid example!
- In order to map the current weather condition to an icon, we just do it manually here. There isn't a perfect match between Environment Canada's preferred terms and the icons we're using (Meteocons by Bas Milius - available from https://github.com/basmilius/weather-icons). But it is pretty close most of the time.
- Some of the terms are adjusted slightly so that they can be used directly in our interface.
It should be readily apparent, then, that if we were to use a different weather data source, some of this
might not be applicable any longer. We'll have a look at how that works a bit later in this post. At this
point, though, we have our Form variables populated with whatever data we could glean from the incoming Home
Assistant data stream, and we're ready to do something about displaying it.
Catheedral Weather UI.
The approach for the weather display is similar to the approach for the climate display - a few rings, a
handful of different values in the middle of the rings, and then a few more around the outside. This data is
likely to change even less frequently than the climate data - perhaps once an hour. We'll be sure to check for
updates, but the mechanism we're using for getting data from Home Assistant should work pretty well here in
terms of ensuring that we're always displaying the latest available data. For the simpler elements of the page,
we can just update them if they've changed. The essence of this is the following. No JavaScript here because,
well, we don't need it.
      // Weather Icon
      display := '<img src="weather-icons-dev/production/fill/svg/'+WeatherIcon+'.svg">';
      if divWeatherIcon.HTML.Text <> display
      then divWeatherIcon.HTML.Text := display;

      // Weather Condition
      if dataWeatherCondition.Caption <> WeatherCondition
      then dataWeatherCondition.Caption := WeatherCondition;

      // Main Temperature Display
      display := Trim(FloatToStrF(WeatherTemperature,ffNumber,5,1)+HATemperatureUnits);
      if dataWeatherTemperature.Caption <> display then
      begin
        dataWeatherTemperature.Caption := display;
        UpdateRing1 := True;
      end;

      // Main Pressure Display
      display := '<span>'+Trim(FloatToStrF(WeatherPressure/10,ffNumber,5,1)+' kPa')+'</span>';
      if WeatherTendency = 'Rising'
      then display := display+'<i class="fa-solid fa-arrow-up ms-2"></i>';
      if WeatherTendency = 'Falling'
      then display := display+'<i class="fa-solid fa-arrow-down ms-2"></i>';

      if labelWeatherPressure.HTML <> display then
      begin
        labelWeatherPressure.HTML := display;
        UpdateRing2 := True;
      end;

      // UV Index Display
      if dataWeatherWind.Caption <> WeatherWind
      then dataWeatherWind.Caption := WeatherWind;

      // UV Index Display
      if WeatherUV = 'unknown' then WeatherUV := 'N/A';
      if dataWeatherUV.Caption <> WeatherUV
      then dataWeatherUV.Caption := WeatherUV;

      // AQHI  Display
      if WeatherUV = 'unknown' then WeatherAQHI := 'N/A';
      if dataWeatherAQHI.Caption <> WeatherAQHI
      then dataWeatherAQHI.Caption := WeatherAQHI;

      // Temp rounded to 5, then +/- 5 to get Range
      WeatherMinTempRange := (Round(WeatherMinTemp / 5) * 5) - 5;
      WeatherMaxTempRange := (Round(WeatherMaxTemp / 5) * 5) + 5;

      // Temp rounded to 20, then +/- 20 to get Range
      WeatherMinPressureRange := (Round(WeatherMinPressure / 20) * 20) - 20;
      WeatherMaxPressureRange := (Round(WeatherMaxPressure / 20) * 20) + 20;

      if not(HAStatesLoaded) then
      begin
        WeatherMinTempRange := 0;
        WeatherMaxTempRange := 100;
        WeatherMinPressureRange := 0;
        WeatherMaxPressureRange := 100;
      end;

      // Minimum Weather Temperature
      display := Trim(FloatToStrF(WeatherMinTemp,ffNumber,5,1));
      if DataWeatherMin.Caption <> display then
      begin
        DataWeatherMin.Caption := display;
        UpdateRing1 := True;
        UpdateRing2 := True;
      end;
      display := 'Min '+FloatToStr(WeatherMinTempRange)+HATemperatureUnits;
      if LabelWeatherMin.Caption <> display then
      begin
        LabelWeatherMin.Caption := display;
        UpdateRing1 := True;
        UpdateRing2 := True;
      end;

      // Maximum Weather Temperature
      display := Trim(FloatToStrF(WeatherMaxTemp,ffNumber,5,1));
      if DataWeatherMax.Caption <> display then
      begin
        DataWeatherMax.Caption := display;
        UpdateRing1 := True;
        UpdateRing2 := True;
      end;
      display := FloatToStr(WeatherMaxTempRange)+HATemperatureUnits+' Max';
      if LabelWeatherMax.Caption <> display then
      begin
        LabelWeatherMax.Caption := display;
        UpdateRing1 := True;
        UpdateRing2 := True;
      end;


      // Minimum Weather Pressure
      display := Trim(FloatToStrF(WeatherMinPressure/10,ffNumber,5,1)+' kPa');
      if DataWeatherMinPressure.Caption <> display then
      begin
        DataWeatherMinPressure.Caption := display;
        UpdateRing1 := True;
        UpdateRing2 := True;
      end;

      // Maximum Weather Pressure
      display := Trim(FloatToStrF(WeatherMaxPressure/10,ffNumber,5,1)+' kPa');
      if DataWeatherMaxPressure.Caption <> display then
      begin
        DataWeatherMaxPressure.Caption := display;
        UpdateRing1 := True;
        UpdateRing2 := True;
      end;

      // Humidity
      display := '<div class="d-flex flex-wrap w-100 align-items-center justify-content-center">'+
                   '<div class="w-100 m-auto"><img style="width:80px; height:80px; margin-bottom:-25px;" src="weather-icons-dev/production/fill/svg-static/humidity.svg"></div>'+
                   '<div style="width:60px; text-align: right;" class="TextSM Gray">'+Trim(FloatToStrF(WeatherMinHumidity,ffNumber,5,0))+'</div>'+
                   '<div style="width:60px; text-align: center;">'+Trim(FloatToStrF(WeatherHumidity,ffNumber,5,0))+'</div>'+
                   '<div style="width:60px; text-align: left;" class="TextSM Gray">'+Trim(FloatToStrF(WeatherMaxHumidity,ffNumber,5,0))+'</div>'+
                 '</div>';
      if dataWeatherHumidity.HTML <> display then
      begin
        dataWeatherHumidity.HTML := display;
        UpdateRing3 := True;
      end;
The Humidity display is a bit excessive, just as it was for the climate version. Perhaps an example of what you could do rather than what you should do! But it works, so not something to be overly concerned about. We're also going through the motions of deciding which rings to update, but as they update so infrequently this may not even be worth the trouble. Code consistency is important though.
Also, display units. There are several places where units are expressed, and several places in Home Assistant where preferences can be made as well. Here, we've kind of given up and just used the units that we want (such as kPa instead of Pa, for example) without regard to what preferences might be set elsewhere. This could be refined a bit further, but we'd also have to be mindful to convert whatever units are being recorded.
The convention, at least for Environment
Canada data, is to record the data along with the units, rather than storing the data in the units that Home
Assistant might suggest. Not sure if that is commonplace with other weather data sources, but likely yet
another little wrinkle to make this more difficult than it needs to be. Home Assistant also isn't doing us many
favors here, as adjusting unit preferences or even adding new units seems to be lacking. There's an option for
"Metric" or "Imperial" but not much other than that.
For the rings, we're using those statistics values to figure out what to use for ranges. As with the climate
rings, we'd expect these to change seasonally, perhaps more dramatically than climate, but this is also our way
of scaling the rings without having to know what units (Celsius or Fahrenheit for example). Beyond that, we're
just drawing the same rings as we did for climate, with the separation at the bottom to give a little more
space.
      if (UpdateRing1 = True) or (tmrSeconds.Tag = 1) then
      begin
        // Weather Temperature (Ring 1)
        segment_start := Trunc(((WeatherTemperature-WeatherMinTempRange)*280) / (WeatherMaxTempRange-WeatherMinTempRange));
        segment := IntToStr(segment_start)+','+IntToStr(280-segment_start)+',80';
        Sparkline_Donut(
          55, 5, 290, 290,                                      // T, L, W, H
          ringWeatherTemperature,                               // TWebHTMLDiv
          segment,                                              // Data
          '["var(--WxRing1)","var(--WxRingB)","transparent"]',  // Fill
          '220deg',                                             // Rotation
          138,                                                  // Inner Radius
          ''                                                    // Text
        );

        // Weather Temperature Marker (Ring 1)
        rotation := IntToStr(220+Trunc(((WeatherTemperature-WeatherMinTempRange)*280) / (WeatherMaxTempRange-WeatherMinTempRange))-2);
        Sparkline_Donut(
          50, 0, 300, 300,                                      // T, L, W, H
          ringWeatherTemperatureMarker,                         // TWebHTMLDiv
          '4/360',                                              // Data
          '["var(--WxRing1)","transparent"]',                   // Fill
          rotation+'deg',                                       // Rotation
          113,                                                  // Inner Radius
          ''                                                    // Text
        );
      end;

      if (UpdateRing2 = True) or (tmrSeconds.Tag = 1) then
      begin
        // Pressure (Ring 2)
        segment_start := Trunc(((WeatherPressure-WeatherMinPressureRange)*290) / (WeatherMaxPressureRange-WeatherMinPressureRange));
        segment := IntToStr(segment_start)+','+IntToStr(290-segment_start)+',70';
        Sparkline_Donut(
          65, 15, 270, 270,                                     // T, L, W, H
          ringWeatherPressure,                                  // TWebHTMLDiv
          segment,                                              // Data
          '["var(--WxRing2)","var(--WxRingB)","transparent"]',  // Fill
          '215deg',                                             // Rotation
          128,                                                  // Inner Radius
          ''                                                    // Text
        );

        // Pressure Marker (Ring 2)
        rotation := IntToStr(215+Trunc(((WeatherPressure-WeatherMinPressureRange)*290) / (WeatherMaxPressureRange-WeatherMinPressureRange))-2);
        Sparkline_Donut(
          50, 0, 300, 300,                                      // T, L, W, H
          ringWeatherPressureMarker,                            // TWebHTMLDiv
          '4/360',                                              // Data
          '["var(--WxRing2)","transparent"]',                   // Fill
          rotation+'deg',                                       // Rotation
          113,                                                  // Inner Radius
          ''                                                    // Text
        );
      end;

      if (UpdateRing3 = True) or (tmrSeconds.Tag = 1) then
      begin
        // Humidity (Ring 3)
        segment_start := Trunc((WeatherHumidity*300) / 100);
        segment := IntToStr(segment_start)+','+IntToStr(300-segment_start)+',60';
        Sparkline_Donut(
          75, 25, 250, 250,                                     // T, L, W, H
          ringWeatherHumidity,                                  // TWebHTMLDiv
          segment,                                              // Data
          '["var(--WxRing3)","var(--WxRingB)","transparent"]',  // Fill
          '210deg',                                             // Rotation
          118,                                                  // Inner Radius
          ''                                                    // Text
        );

        // Humidity Marker (Ring 3)
        rotation := IntToStr(210+Trunc((WeatherHumidity*300) / 100)-2);
        Sparkline_Donut(
          50, 0, 300, 300,                                      // T, L, W, H
          ringWeatherHumidityMarker,                            // TWebHTMLDiv
          '4/360',                                              // Data
          '["var(--WxRing3)","transparent"]',                   // Fill
          rotation+'deg',                                       // Rotation
          113,                                                  // Inner Radius
          ''                                                    // Text
        );
      end;
That gets us our weather panel on the Catheedral home page. But we've left out quite a lot of data -
forecasts for example - that we'd really like to include. So let's add another page to our UI to handle that.
Weather Page.
Here's where we'd like to display the hourly and daily forecasts, if possible, along with any other data like a
summary or an alert if available. Some weather data sources will have more data than others. For example, in
the data we're working with from Environment Canada, we have a "condition" value that we can use to get our icon, minimum and maximum
temperatures, and a "precipitation_probability" value. But not an amount of precipitation. And we've got six
entries in the forecast array, good for the daily forecast. It's a starting point, at least.
There are other data elements that can be enabled for this Environment Canada data source, with "hourly_forecast" and "radar" data being solid candidates. These have to be enabled using the "Entity" page within Home Assistant - they are disabled by default. The hourly forecast, as one might expect, gives the same set of forecast values, but for each of the next 24 hours. Pretty good! We're not going to use the radar data here today, as it is configured in Home Assistant to work like a camera. So we'll save that for another upcoming post for using cameras in TMS WEB Core and Catheedral. We will, however, cover another source of radar and satellite images later in this post that we can use more easily.
So for our UI, the idea is to have sections for hourly forecasts and daily forecasts as well as a place to
stick other text information. As the text section might vary a great deal depending on how chatty (or alarmist!)
the meteorologist is at any given point, we'd like the text part to grow and shrink, and by extension, the rest
of the interface to adjust itself accordingly. A tiny bit of a dynamic layout, but most of the elements will
remain the same. Here's a look at what all the <div> elements look like loosely laid out, with a bit of
color, before they are stretched and fit into their final positions. This is essentially how they're set in the
Delphi IDE, where the CSS rules do not apply.
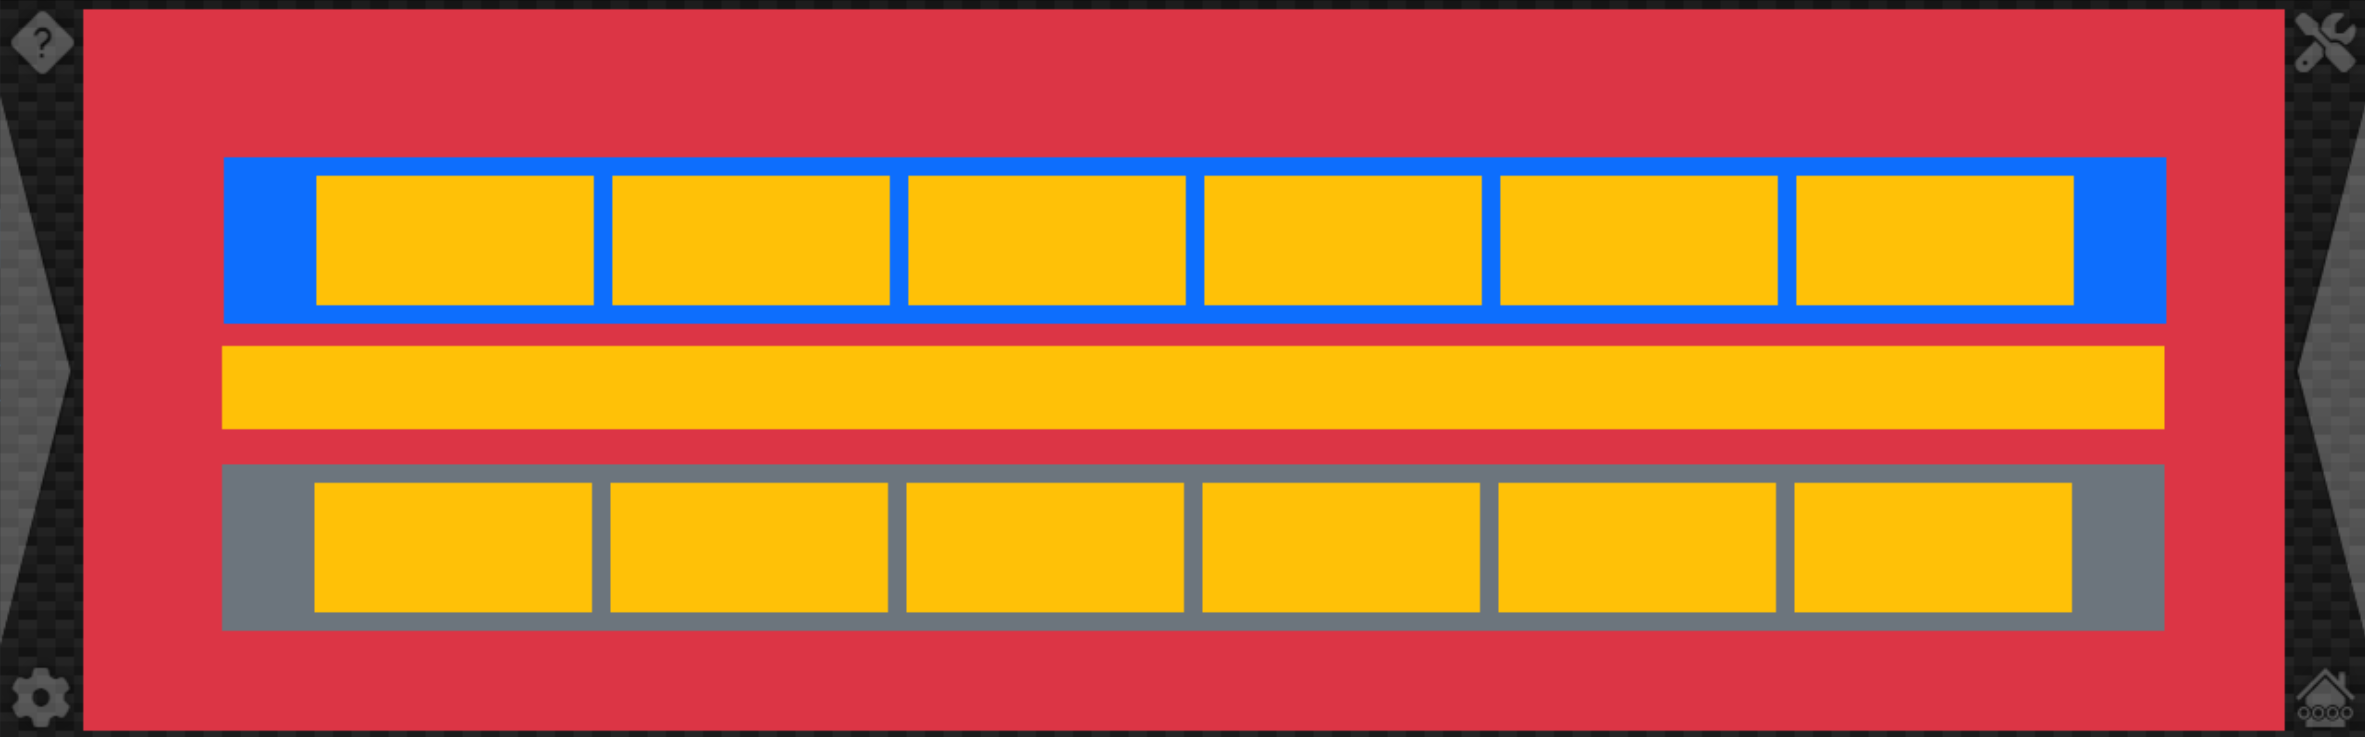
Weather Page Layout.
Each of the six rectangles in the top and bottom sections will have the forecast information (weather icon,
min, max, precipitation) while the middle section will have whatever text information, if any, that is
available. These three main rectangles will stretch to fill the outer rectangle, with the middle text rectangle
growing or shrinking automatically based on the amount of text. This is all handled by CSS flex. Initially, this is done by
assigning the Bootstrap "d-flex" class and removing the "absolute positioning" properties of each. The
Bootstrap "gap-1" class is used to give a bit of padding between the elements but not at the edges. As there's
no content, the three rows initially are the same height.
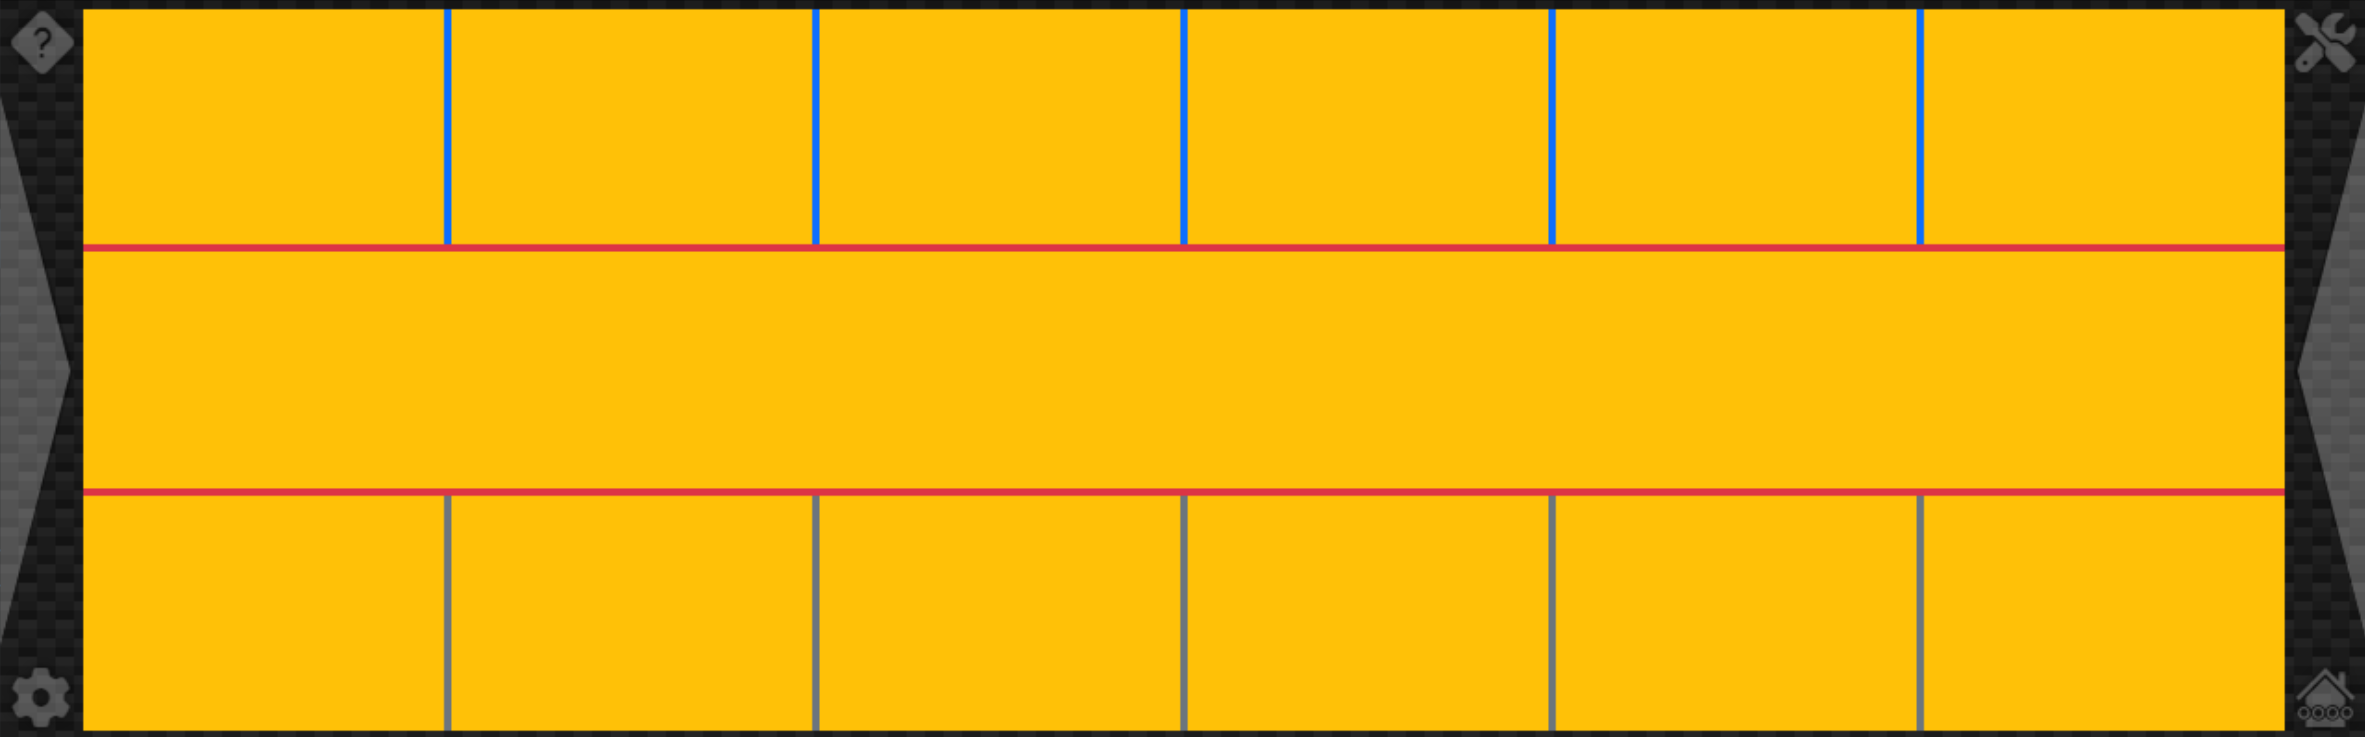
Weather Page Layout after Stretching.
From here, we can add borders around the top and bottom elements, and add some placeholder text to the middle
section to give a better idea of what we're working with.
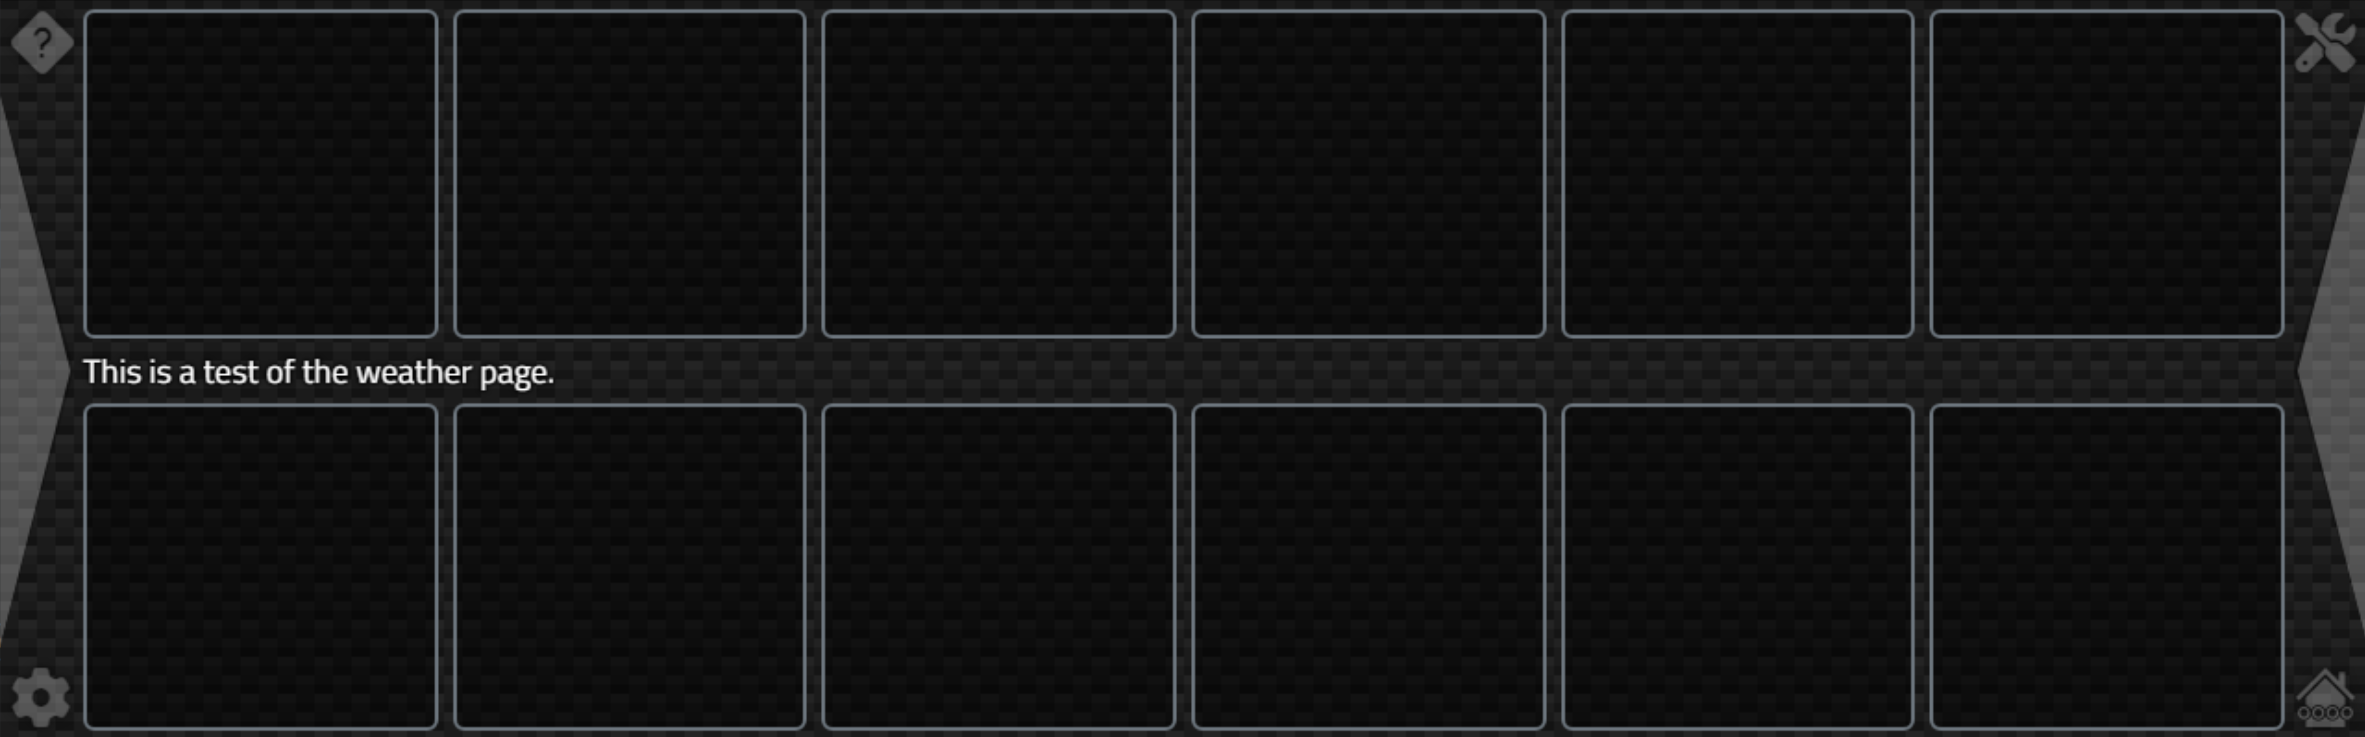
Weather Page Layout - Placeholders.
Note how the middle section is now just enough to hold the text. The top and bottom heights are adjusted to
fill the space. If we had a longer block of text, perhaps with an alert message included, the top and bottom
heights would again be adjusted to fit the space available.
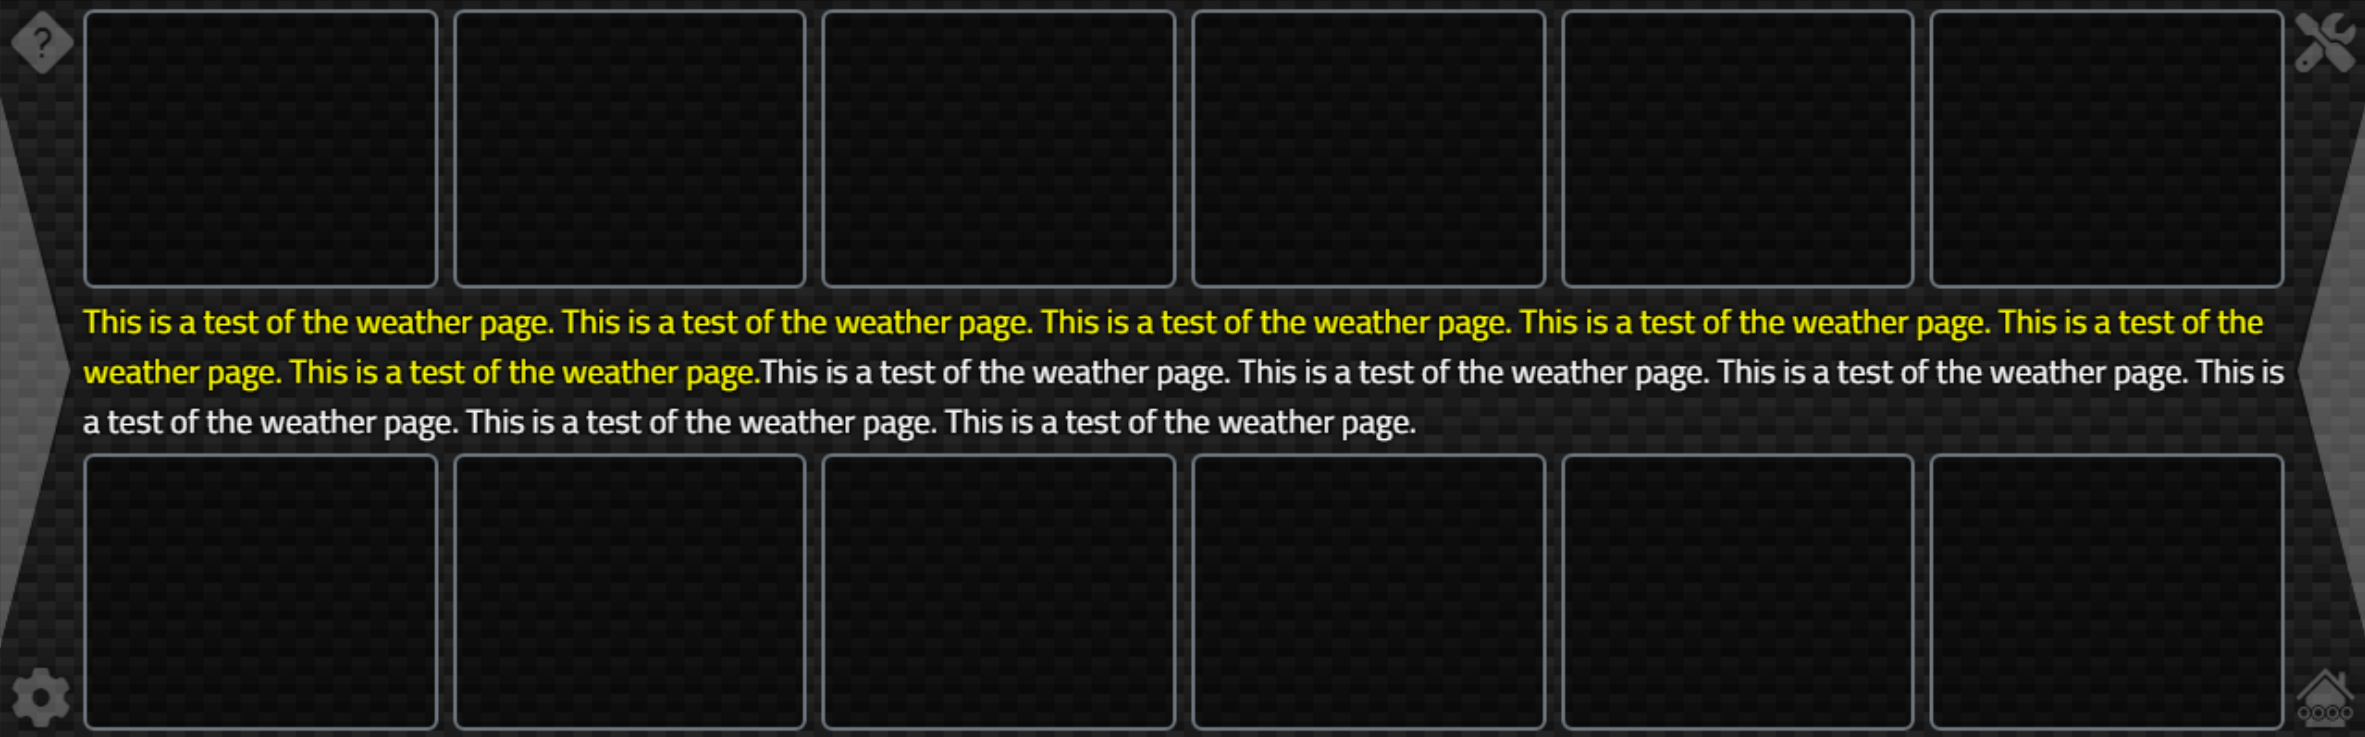
Weather Page Layout - Automatic Sizing.
That works pretty well, but we'll have to keep in mind the variable heights for the individual hour/day
forecast bits. Which is the next thing we'll need to implement. By looking at our forecast arrays, we can
figure out what to display. We only have a handful of elements to work with, so we can try and pick them up as
they arrive from Home Assistant.
To make this as flexible as possible, we'll have to essentially search the
sensor data to see if we can find what we're interested in. As we can now have more than one source of forecast
data (daily and hourly), as well as advisory and summary information, we'll have to add a few more sensors to
our Home Assistant integration configuration and pick those up as they arrive. A pressure "tendency" value has
also been added to the data since this project started, so we'll get that one too. We'll cover the Radar and
Satellite links shortly. So no less than six (?!) new entries here (#29-#34).
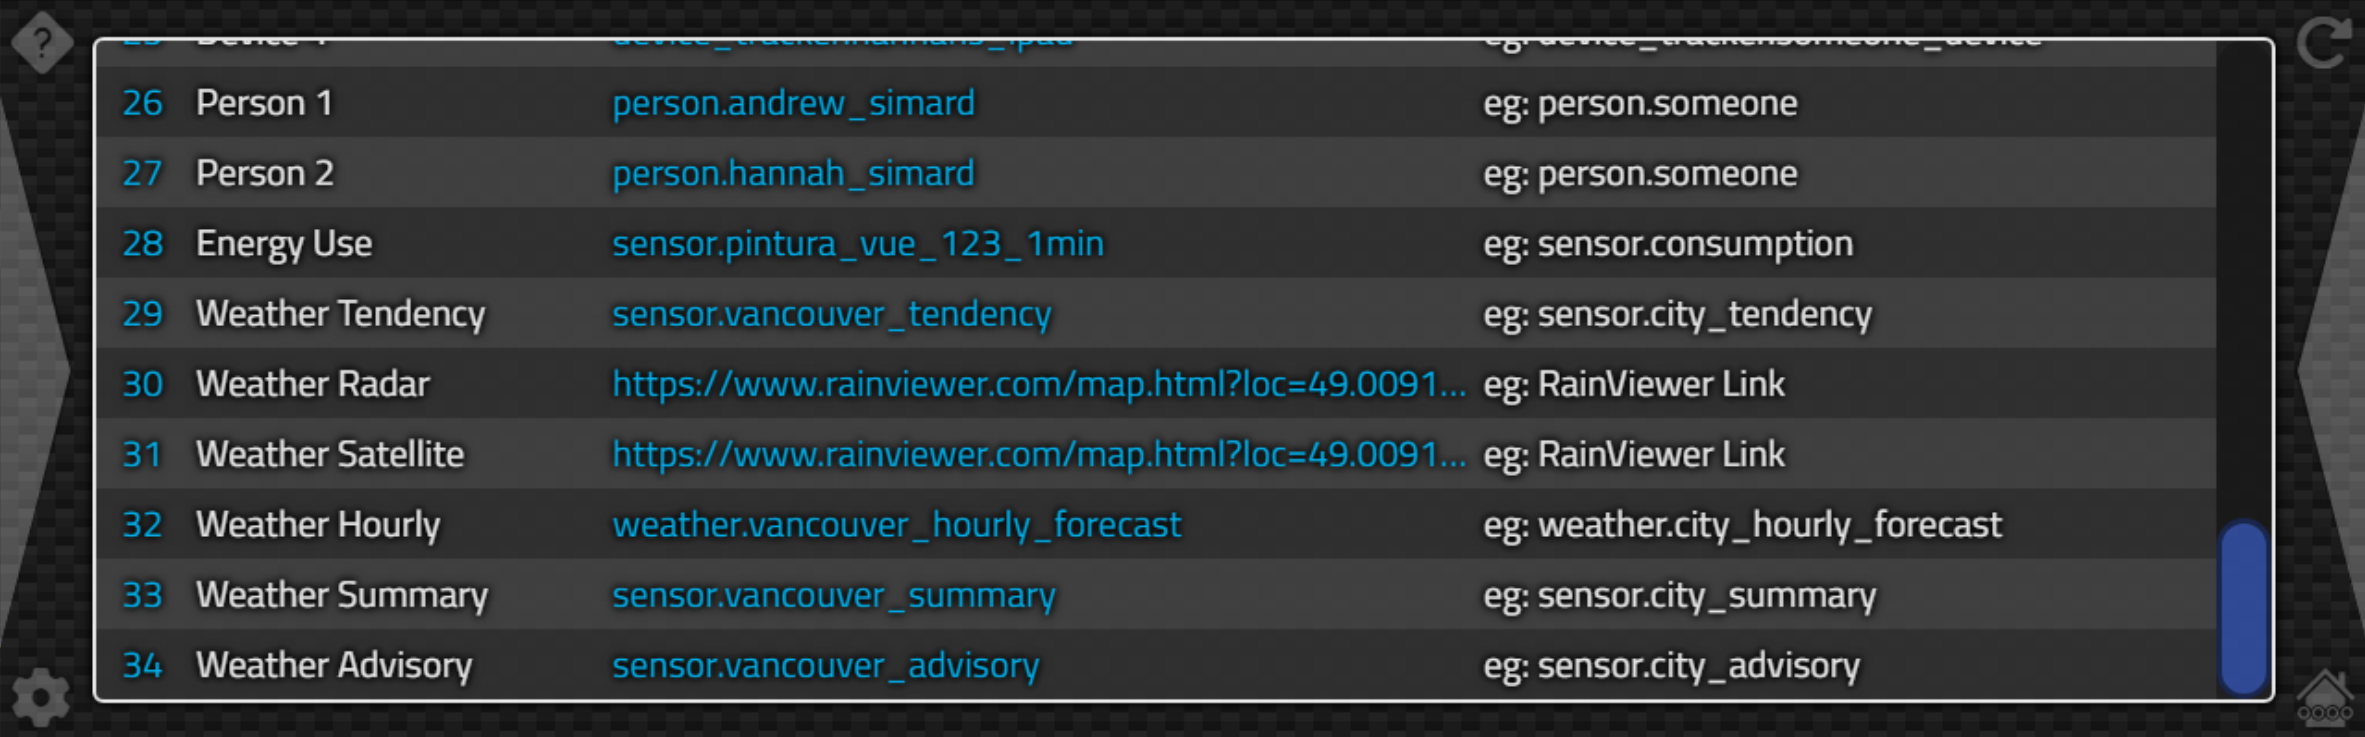
More Weather-Related Configuration Options.
For the weather advisory and summary information, these are just blocks of text. So we can add them to a
<div> element easily enough. Here, we're changing the color of the advisory text, but otherwise just
displaying it as-is.
  // Set middle text - Advisory and Summary values
  if WeatherAdvisory ='0' then WeatherAdvisory := '';
  if (WeatherAdvisory = '') and (WeatherSummary = '')
  then divWxText.HTML.Text := ''
  else divWxText.HTML.Text := '<span class="Yellow">'+WeatherAdvisory+'</span>'+WeatherSummary;
For the forecasts, depending on where we're getting the information, we could have two sets - one from an "hourly sensor" and one from a "daily sensor". In the code where we process incoming Home Assistant data, we capture either coming our way by checking for a "forecast" object within the State that we've got. As there could potentially be two of them, we'll keep track of them using two separate WeatherForecast values. These are just JSValue Form variables, meaning that whatever forecast data has been picked up is just stored at that stage. We'll process it here in just a moment.
      if ((Entity == this.WeatherSensor1) && (State.attributes.forecast !== undefined)) {
        this.WeatherForecast1 = State.attributes.forecast;
      }
With our sensors configured and collecting data, we now have a WeatherForecast1 and WeatherForecast2 value, each containing an array of forecast values. For our Environment Canada data, the first is a set of 6 daily forecasts, and the second is a set of 24 hourly forecasts. We'd like to use the "conditions" value in this data to display an icon, so we'll take the weather icon code we were using previously and create a new function so we don't have to repeat ourselves. Is DRY still a thing? I'm sure it is.
function TForm1.GetWeatherIcon(var Condition: String): String;
var
  WeatherCondition: String;
begin
  Result := 'not-available';
  WeatherCondition := Condition;

  // Make this a little more presentable
  asm WeatherCondition = window.CapWords(WeatherCondition); end;

  // Environment Canada Contitions - other data sources may be very different!!
  // https://github.com/home-assistant/core/blob/dev/homeassistant/components/environment_canada/weather.py

  if WeatherCondition = 'Partlycloudy' then WeatherCondition := 'Partly Cloudy';
  if WeatherCondition = 'Clear-night' then WeatherCondition := 'Clear Night';
  if WeatherCondition = 'Snowy-rainy' then WeatherCondition := 'Snowy Rainy';

  // These are the ones we know about!
  if      WeatherCondition = 'Sunny' then Result := 'clear-day'
  else if WeatherCondition = 'Clear Night' then Result := 'clear-night'
  else if WeatherCondition = 'Partly Cloudy' then Result := 'partly-cloudy-day'
  else if WeatherCondition = 'Cloudy' then Result := 'cloudy'
  else if WeatherCondition = 'Rainy' then Result := 'rain'
  else if WeatherCondition = 'Lightning Rainy' then Result := 'thunderstorms-rain'
  else if WeatherCondition = 'Pouring' then Result := 'extreme-rain'
  else if WeatherCondition = 'Snowy Rainy' then Result := 'extreme-snow'
  else if WeatherCondition = 'Snowy' then Result := 'snow'
  else if WeatherCondition = 'Windy' then Result := 'wind'
  else if WeatherCondition = 'Fog' then Result := 'fog'
  else if WeatherCondition = 'Hail' then Result := 'hail';

  // Send back the new value in case it has changed
  Condition := WeatherCondition;
end;
Note that we're doing a little more work here by also using a var parameter so the weather condition passed in
is prettied up a little bit when the function completes. We use this on the home page in Catheedral, but also
as a "title" tooltip so that if ever something is amiss, we can readily see what it is supposed to be. This
happens when a weather condition is reported that doesn't match something in our list. Usually because we
perhaps maybe could possibly have made a typo.
With that in hand, the main item we're left with is filling in a box with data. Icon top-left. Date/Time
top-right. Max/Min temperatures. And POP/Precip data. Doesn't sound hard but a bit mucky to implement. And
as we'll be doing this a dozen times, we might as well create a function. We'll pass in a forecast "element"
and the <div> that we want to populate it with. If we're displaying daily forecasts we don't want to
display the time, so we'll use that as a parameter as well.
procedure TForm1.DrawWeather(Element: TWebHTMLDiv; WeatherData: JSValue; ShowTime:Boolean);
var
  weathercondition: String;
  weathericon: String;
begin
  // Get updated weather condition value (prettied up) and the icon
  asm weathercondition = WeatherData.condition; end;
  weathericon := GetWeatherIcon(weathercondition);

  asm
    // A fixed width implies a fixed height for the icon.
    weathericon = '<img title="'+weathercondition+'" width="90" src="weather-icons-dev/production/fill/svg/'+weathericon+'.svg">'

    // Use Luxon to get our UTC timestamp into today's date. Luxon('ccc') = FormatDateTime('ddd') if anyone is wondering
    var wday = '<div class="Text TextLG White m-0 p-0 pb-2">'+luxon.DateTime.fromISO(WeatherData.datetime,{zone:"utc"}).setZone("system").toFormat('ccc')+'</div>';

    // Same goes for the time. We're assuming :00 here just in case it isn't!
    var wtime = '';
    if (ShowTime == true) {
      wtime = '<div class="Text TextSM Gray m-0 p-0">'+luxon.DateTime.fromISO(WeatherData.datetime,{zone:"utc"}).setZone("system").toFormat('HH:00')+'</div>';
    }

    // These should all be numbers.  But sometimes they are missing or are returned as null values
    var maxtemp = WeatherData.temperature;
    var mintemp = WeatherData.templow;
    var pop = WeatherData.precipitation_probability;
    var precip = WeatherData.precipitation;

    // The first vertical section has the icon on the left and the date/time on the right
    var weather = '<div class="d-flex m-0 p-0 flex-row align-items-between" style="margin-bottom:-10px !important;">'+
                    weathericon+
                    '<div class="d-flex flex-column m-0 p-0 h-100 w-100 align-items-center justify-content-center">'+
                      wday+
                      wtime+
                    '</div>'+
                  '</div>';

    // The second vertical section has the Hi and Lo values, either of which may be missing
    weather += '<div class="d-flex m-0 p-0 gap-3 flex-row justify-content-center align-items-baseline">';
    if (!isNaN(maxtemp) && (maxtemp !== null)) {
      weather += '<div><span class="Text TextSM Gray m-0 pe-2">Hi</span>'+
                 '<span class="Text TextLG White m-0 p-0">'+maxtemp+'</span></div>';
    }
    if (!isNaN(mintemp) && (mintemp !== null)) {
      weather += '<div><span class="Text TextSM Gray m-0 pe-2">Lo</span>'+
                 '<span class="Text TextLG White m-0 p-0">'+mintemp+'</span></div>';
    }
    weather += '</div>';

    // The third vertical section has the Pop and Precip values, either of which may be missing
    weather += '<div class="d-flex m-0 p-0 gap-3 flex-row justify-content-center align-items-baseline">';
    if (!isNaN(pop) && (pop !== null)) {
      weather += '<div><span class="Text TextSM Gray m-0 pe-2">Pop</span>'+
                 '<span class="Text TextRG White m-0 p-0">'+pop+'%</span></div>';
    }
    if (!isNaN(precip) && (precip !== null)) {
      weather += '<div><span class="Text TextSM Gray m-0 pe-2">'+this.WeatherPrecipUnits+'</span>'+
                 '<span class="Text TextRG White m-0 p-0">'+precip+'</span></div>';
    }
    weather += '</div>';

    // Assign all that to the box we're updating
    Element.innerHTML = weather;

    // And if we've got a Probability of Precipitation, lets change the background
    // color of the block to indicate its value (0%..100% -> blue = 0..255 )
    Element.style.setProperty('background','rgba(0,0,'+pop*2.55+',0.5)');
  end;

end;
This is essentially constructing a pile of HTML with Bootstrap classes being thrown around all over the place. That kind of thing can get a bit out of hand when there's a desire to tweak every little thing. But as we've covered at other times, every pixel on the page is up for grabs, so if something isn't exactly where you want it to be, there's likely a Bootstrap class, a style property or a CSS override somewhere that can be brought in to do the dirty work.
The very last line, for example, is used to change the background of the box to some variation of blue, with brighter shades used when the probability of precipitation is higher. Probably a dozen other ways to do this, but this one is kinda fun.
The mapping between the 12 boxes and the forecast data that we've received from Home Assistant is then the last
piece of the puzzle. We know we've got six boxes at the top for hourly forecast data, and six at the bottom for
daily forecast data. But we've got 24 hours of forecast data. So we'll leave some out and just populate the
boxes with every fourth value. Something like the following.
  asm
    // eg: Environment Canada Regular Forecast
    if (this.WeatherForecast1.length == 6) {
      this.DrawWeather(divWxD1, this.WeatherForecast1[0],false);
      this.DrawWeather(divWxD2, this.WeatherForecast1[1],false);
      this.DrawWeather(divWxD3, this.WeatherForecast1[2],false);
      this.DrawWeather(divWxD4, this.WeatherForecast1[3],false);
      this.DrawWeather(divWxD5, this.WeatherForecast1[4],false);
      this.DrawWeather(divWxD6, this.WeatherForecast1[5],false);
    }

    // eg: Environment Canada Hourly Forecast
    if (this.WeatherForecast2.length == 24) {
      this.DrawWeather(divWxH1, this.WeatherForecast2[ 3],true);
      this.DrawWeather(divWxH2, this.WeatherForecast2[ 7],true);
      this.DrawWeather(divWxH3, this.WeatherForecast2[11],true);
      this.DrawWeather(divWxH4, this.WeatherForecast2[15],true);
      this.DrawWeather(divWxH5, this.WeatherForecast2[19],true);
      this.DrawWeather(divWxH6, this.WeatherForecast2[23],true);
    }
  end;
Then, if we get some other weather data with forecast information, hopefully, it will either flow the same way,
or we can add a similar block of code to make it work the same way. We'll see an example of this in just a
moment. But first, let's have a look at what we've created.
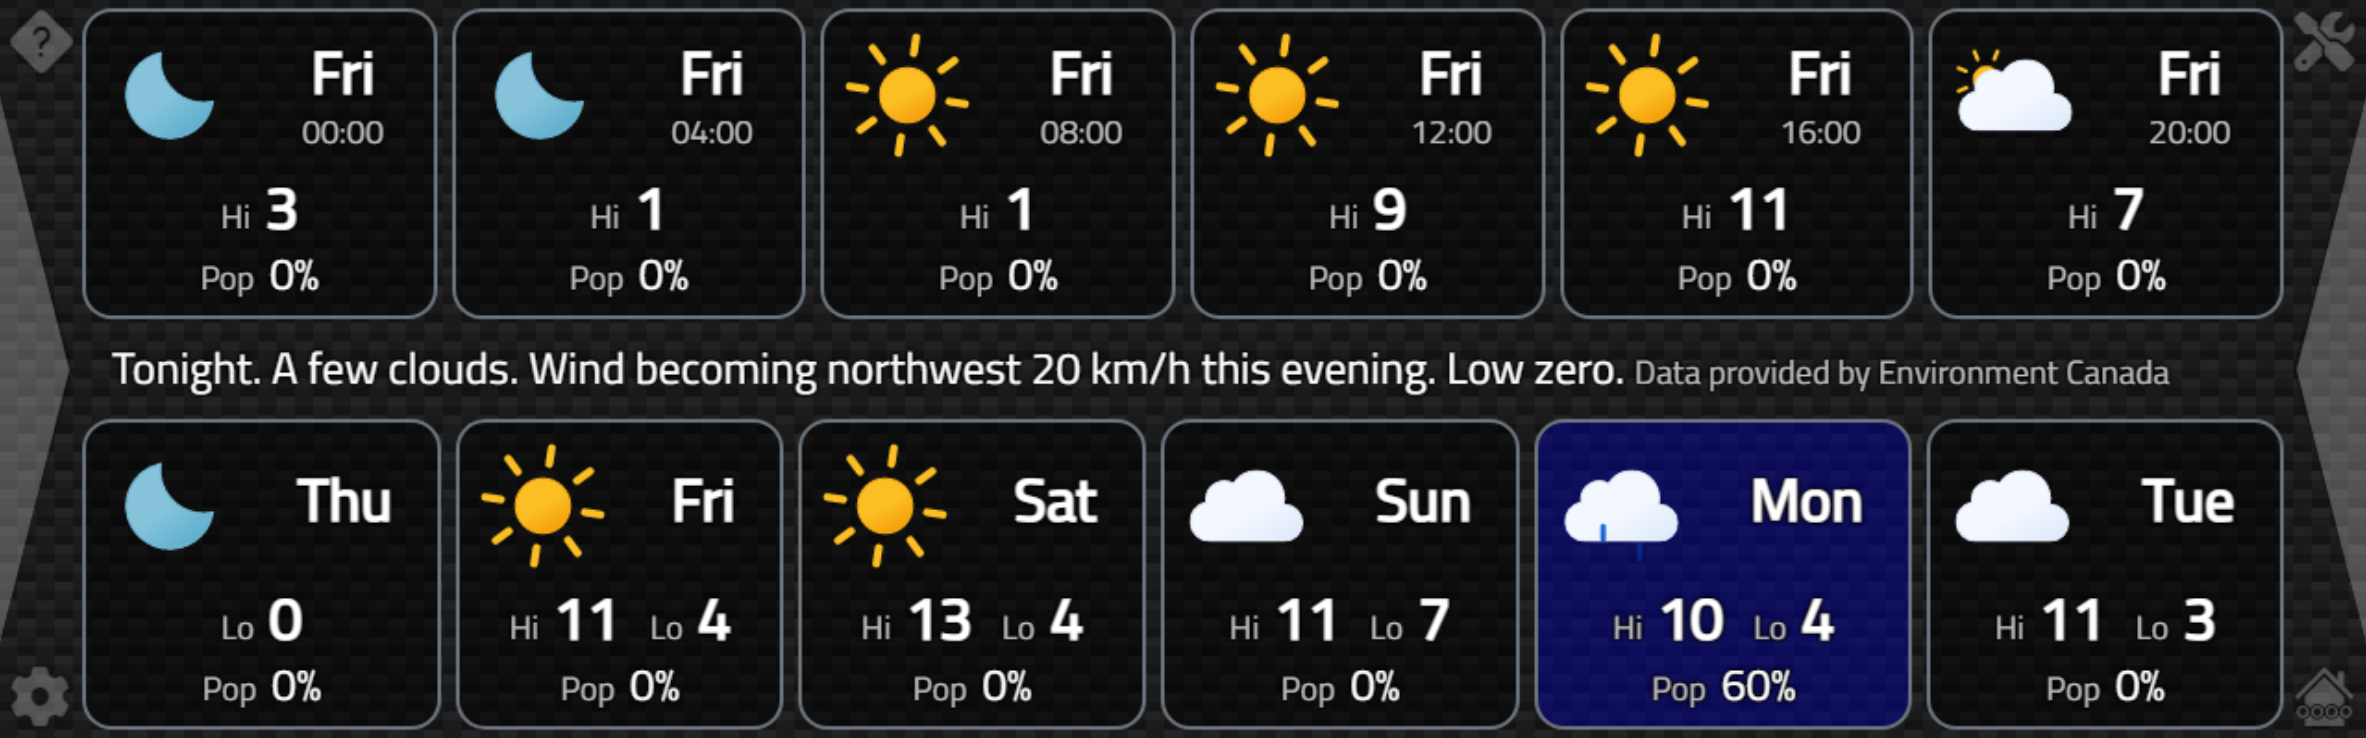
Completed Weather Page.
The spacing between the lines of text vertically has enough play in it that increasing the text in the middle
doesn't mess things up. If data is missing, it is simply not shown. Like the bottom-left box, where for
whatever reason we have a minimum temperature reported but not a maximum temperature - that's what's in the
data. Likewise for the missing minimum temperatures on the hourly forecasts. Also, note that these are all
animated icons. We wouldn't want that many animated icons on the home page all of the time as that would waste
quite a lot of CPU rendering cycles, and may even potentially lead to overheating something like a Raspberry
Pi. But for a page that is only viewed periodically (even if it is the most viewed page after the home page),
this should work out just fine.
OpenWeatherMap Data.
So that works pretty well, and there's really not much going on that is specific to Environment Canada in terms
of how we're handling the data coming from Home Assistant. Mostly two places. Selecting a weather icon based
on a "condition" text value like "sunny" or "cloudy". And then finding a set of forecast values to use, which
in this case has been two sets - one for hourly and one for daily. But what if we're not in Canada? Well, one
of the more broadly usable weather resources is the OpenWeatherMap service. It reports data for more than
200,000 cities. And it has an "integration" available for Home Assistant.
The installation of the integration into Home Assistant is relatively straightforward. An API key is required, however. The integration will direct you to where you can register to get an API key, and several levels of service provided by OpenWeatherMap (including free levels) are available. Different services offer, naturally, different amounts of data, particularly when it comes to forecast information and, most importantly, in terms of how many requests can be made in a given period. If you're looking to embed your own API key in an app that is broadly distributed, this is something to keep in mind. Most of the time, as is the case with Home Assistant itself, it would likely be best to have individual users sign up for their own API key. Which is not fun, to be honest.
Once configured, we're in familiar territory. We'll have a pile of new sensors that we can then use in our
Catheedral configuration page. To be thorough, we'd also have to update the statistics that we configured in
the Home Assistant configuration.yaml file to use this new data source. Fortunately, we don't have to change
anything in our app for that change to be reflected - the sensor names and content would remain the same. The
biggest initial difference is that there are a number of sensors that don't have a corresponding OpenWeatherMap
equivalent. For example, the air quality index, text summary, and text advisory sensors don't seem to have an equivalent in this data source.
On the other hand, there are many other elements that are not part of Environment Canada's data stream. Most
notably, perhaps, is that there is considerably more information in the forecast. Including wind, pressure, and
precipitation forecast values. Not as far out a forecast though. With the API key I've used, there are 40 data
points - every three hours - so five days' worth. For our 12 spots, then, we can do something like pick the
first 8 values and then every 8th value (one per day).
    // eg: OpenWeatherMap Free API
    if (this.WeatherForecast1.length == 40) {
      this.DrawWeather(divWxH1, this.WeatherForecast1[ 0],true);
      this.DrawWeather(divWxH2, this.WeatherForecast1[ 1],true);
      this.DrawWeather(divWxH3, this.WeatherForecast1[ 2],true);
      this.DrawWeather(divWxH4, this.WeatherForecast1[ 3],true);
      this.DrawWeather(divWxH5, this.WeatherForecast1[ 4],true);
      this.DrawWeather(divWxH6, this.WeatherForecast1[ 5],true);
      this.DrawWeather(divWxD1, this.WeatherForecast1[ 6],true);
      this.DrawWeather(divWxD2, this.WeatherForecast1[ 7],true);
      this.DrawWeather(divWxD3, this.WeatherForecast1[15],true);
      this.DrawWeather(divWxD4, this.WeatherForecast1[23],true);
      this.DrawWeather(divWxD5, this.WeatherForecast1[31],true);
      this.DrawWeather(divWxD6, this.WeatherForecast1[39],true);
    }
The attribute names used in the forecast elements are the same, so nothing else is really needed. We end up
with the following page.
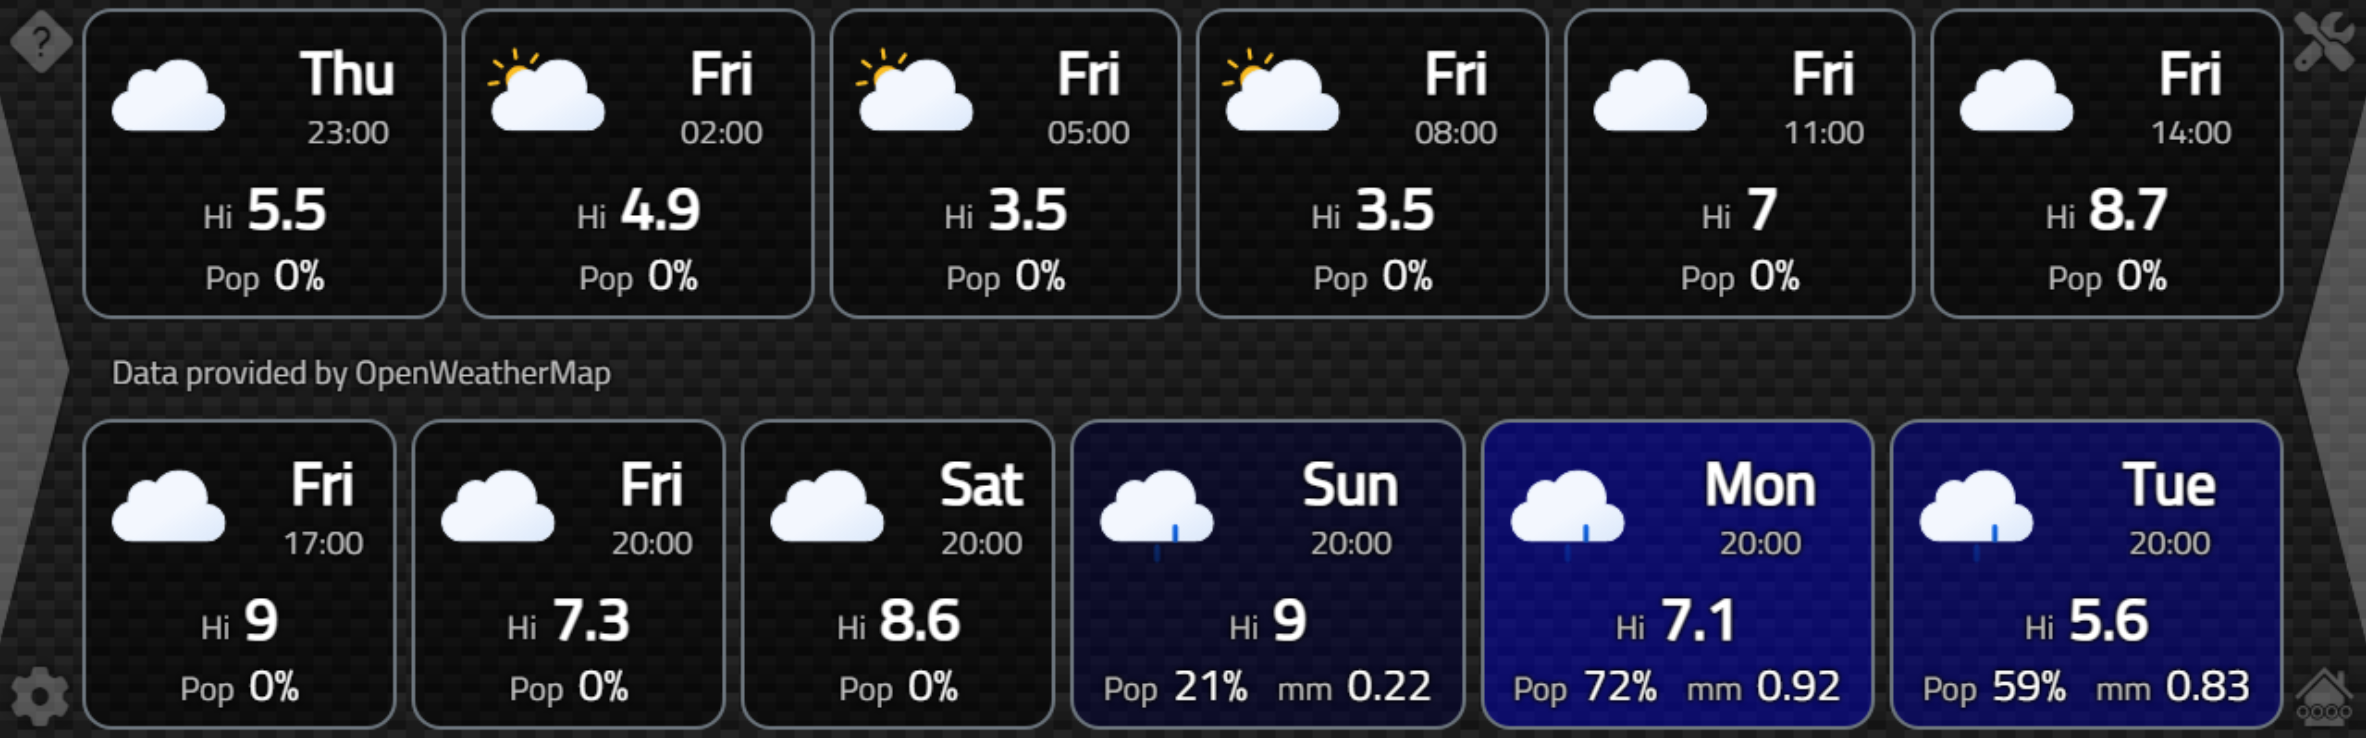
Same Forecast from OpenWeatherMap.
Curiously, the forecast doesn't include minimum temperatures. Kind of a deal breaker where I live, as that's
likely to be the more important temperature for a good part of the year. But regardless, we can see that data
flows through using the same Home Assistant interface without much work on our part. If this were to be our
primary weather data source, we'd perhaps go through the trouble of including the forecasted pressure and wind
values in this display. And if you look carefully, those boxes in the bottom right are wider than the
rest...?! This is great, but probably not great for the UI when it rains every day, so some extra tweaking
might be in order there. Maybe get rid of "Pop" if "Pop" is not zero, for example.
This isn't the only way to display this kind of data. We could use a chart. This might work better for the OpenWeatherMap forecast data given that it is just a series of 40 data points. Or a combination of boxes and charts. We could craft something similar to the Home Assistant cards we saw earlier. Or come up with something else completely novel.
The lesson here, at the end of the day, is that there's not really any limit to what we
can do. I kinda like the Environment Canada data the best, despite missing precipitation forecasts, and this
layout is simple enough to be useful to a reasonably large group of people.
More Data.
There's another substantial candidate for weather data that we might want to include in our Catheedral app - imagery. The most popular kinds of imagery are satellite weather data and radar data. Once upon a time, many decades ago, I worked as a co-op student for Environment Canada. Working on things like processing satellite data. Back when the running joke was how our federal government had just bought a supercomputer that could produce tomorrow's forecast with just three days' computational time. Probably not true, but still funny. At least at the time.
Both kinds of imagery can be helpful but generally have different uses. Radar would be
useful when looking at rainfall in nearby locations. Satellite imagery isn't all that useful for that, but good for
seeing what's coming in terms of large weather systems, and is usually updated less frequently.
The Home Assistant feed coming from Environment Canada includes radar imagery. This is configured in Home Assistant like a camera, so not quite as trivial to implement as we've been doing so far. We'll have a look at that when we look at cameras generally in a few posts from now. So what to do?
Well, it turns out there's a
relatively new, and incredibly fantastic, weather data source called RainViewer. This has nothing really to do with Home Assistant. But what it does have is the ability to configure a
particular weather page on its website that can then be embedded elsewhere using an <iframe>. They even
have the <iframe> embedding information presented, ready to be copied & pasted into another website. And no API key is required.
For our purposes, this is just perfect! What we'll need, though, is a place to store it and then a way to view it. Sounds like a job for more configuration parameters. Two have been added - one for radar imagery and one for satellite imagery. These just need the configured URL copied from the RainViewer website. While there, you can select the map location and zoom level, as well as whether it is a radar image or satellite image, whether there is a legend, and so on. This results in a new URL with different query parameters. We're using two because it is most likely the case that you'd want a different zoom level for these two kinds of data.
Once we've got these URLs, we can display them in an <iframe> in the same way as we do the custom URLs we
configured a while back. We can even add a couple of icons to the home page (a radar icon and a satellite icon)
if these values have been entered. Then we can just tap on them to see the animations.
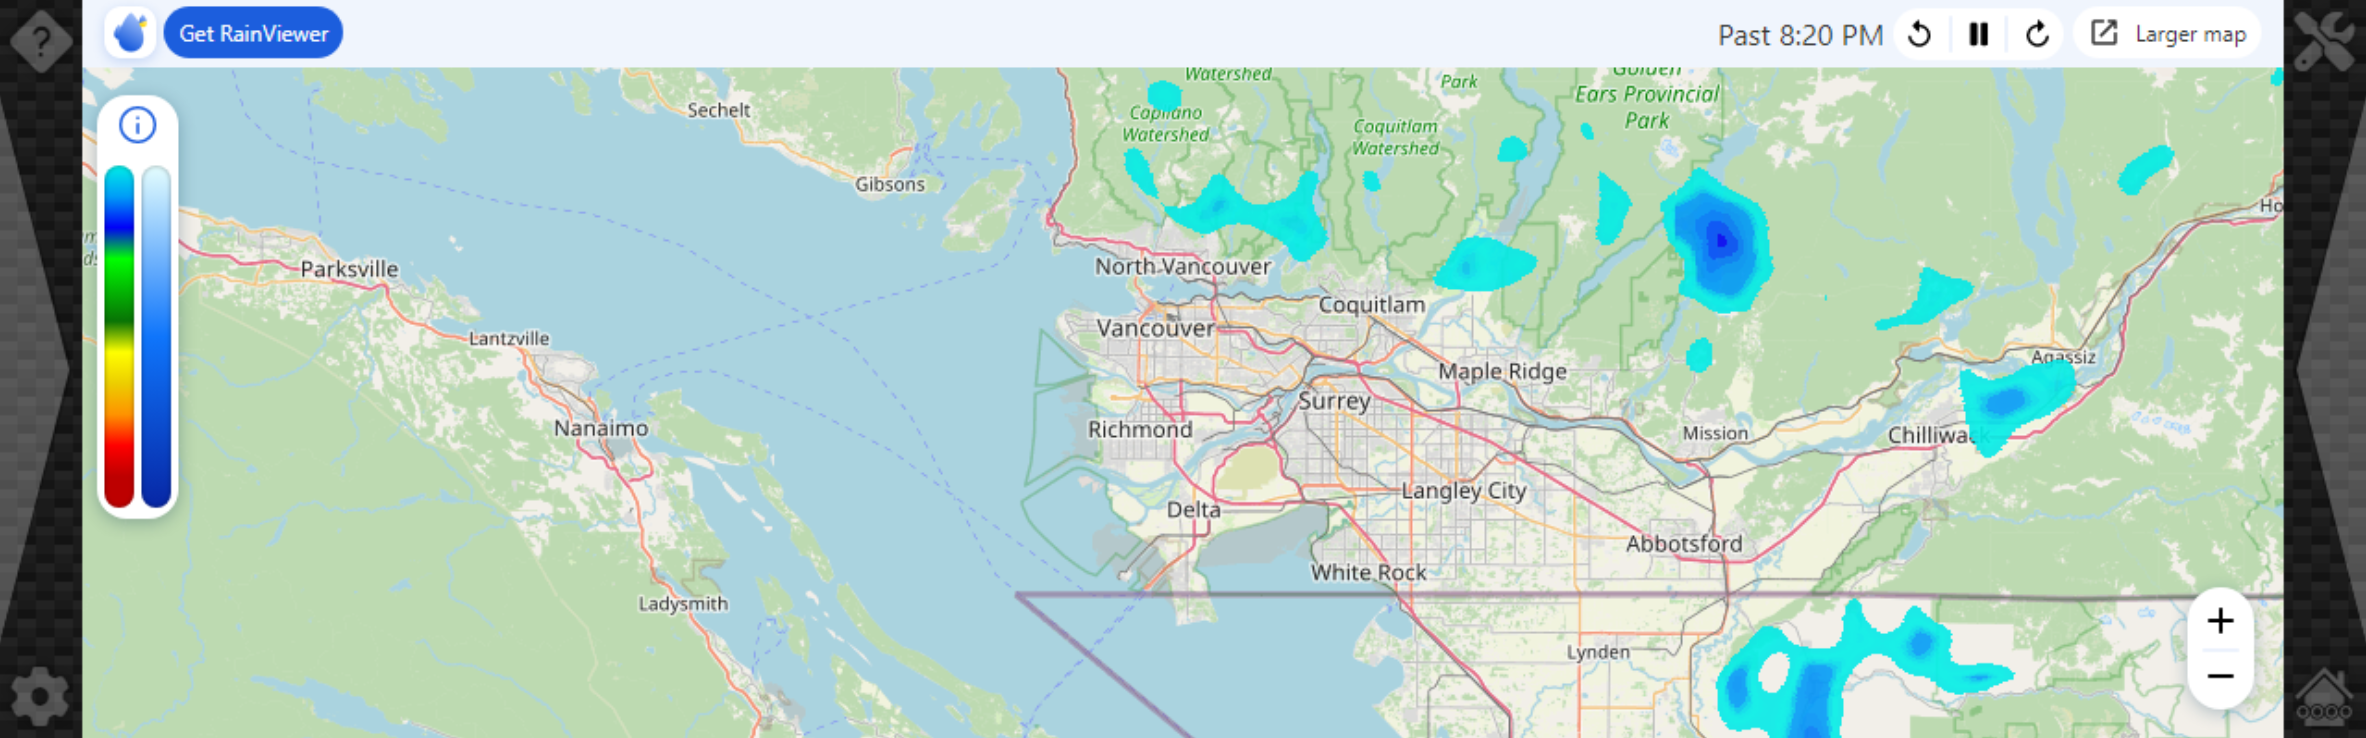
RainViewer Radar Image.
Not much going on there, but we can see in the satellite image that something is on its way!
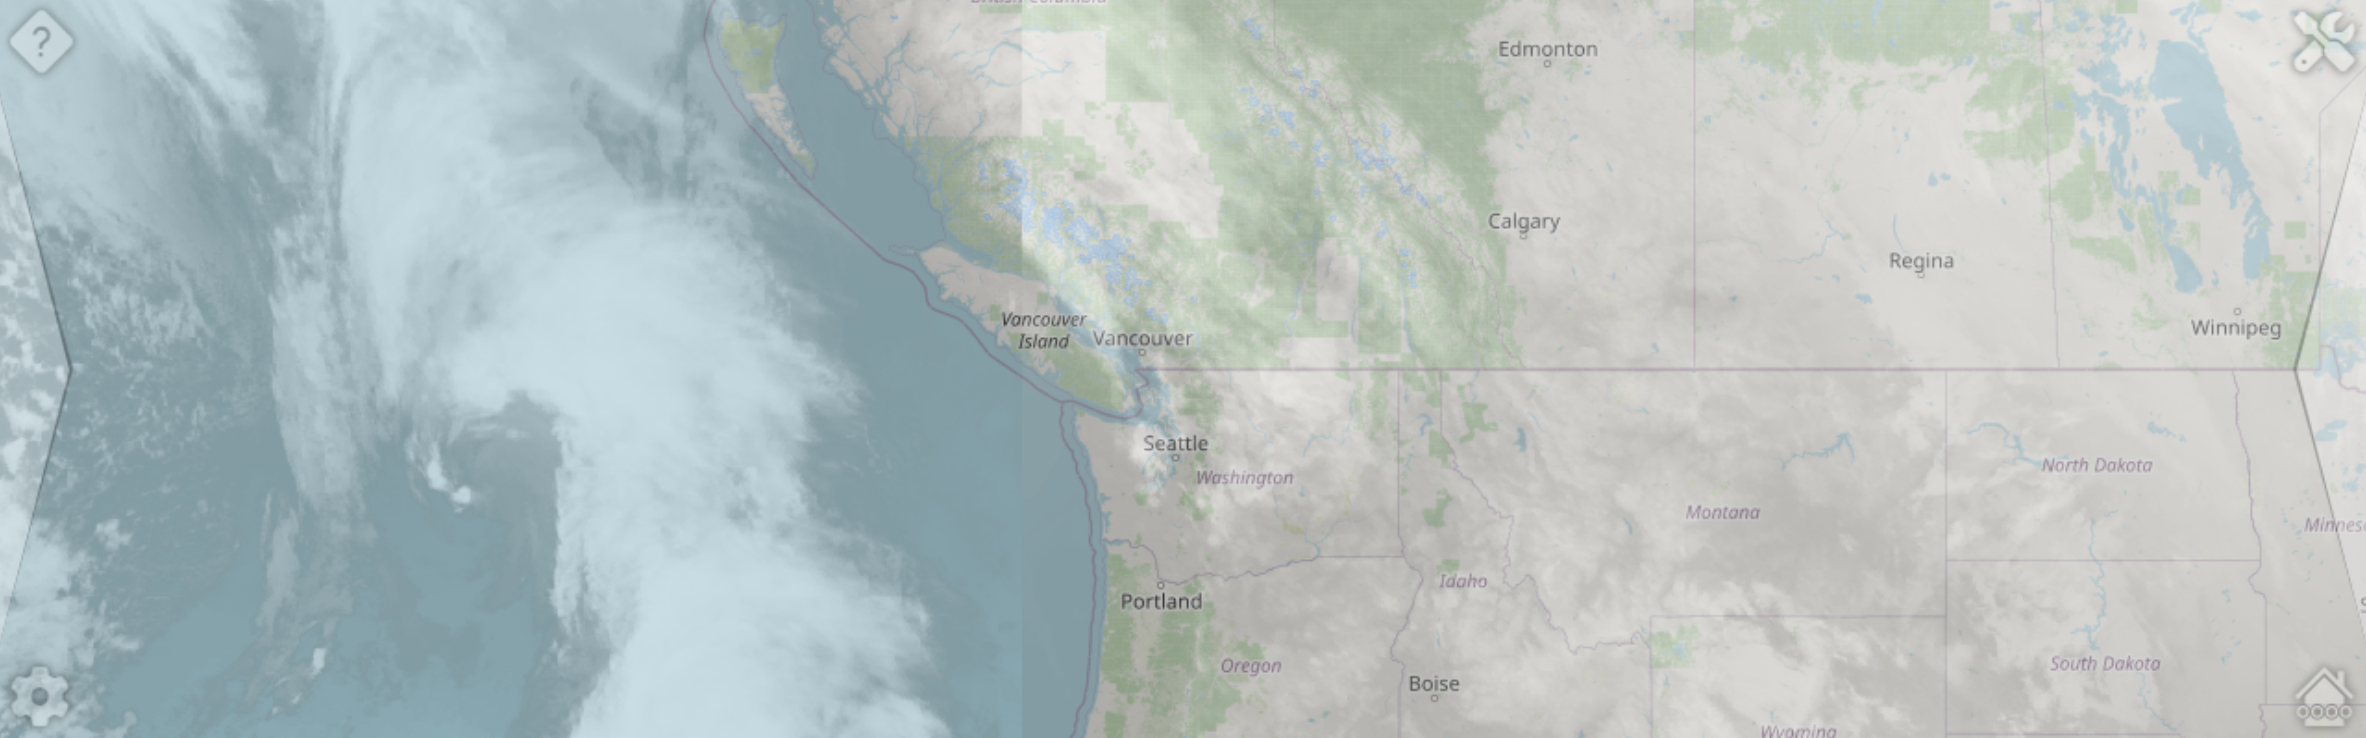
RainViewer Satellite Image.
Note that here we've resized the <iframe> so that the credits and controls are outside of the visible
page. And a handy reminder of why we have all those drop shadows everywhere! This isn't really a good idea
generally - obscuring the interface or attribution of a website hosted in an <iframe> as we've done here.
Probably against the terms of service of any organization offering data as freely as is being done here. But it
works. We could add our own attribution label (and probably will in due course).
In general, when integrating
other websites using <iframe> elements, this is a common problem - not being able to fit it perfectly in
your own website. If you find yourself in a position to be offering <iframe> elements for your own
content to be hosted elsewhere, consider adding more options to control the placement of controls and attribution,
so as to not interfere or overlap with other elements. We're already a bit beyond the norm though, as we're
overlaying components directly on their webpage. Which is generally not what they'd be expecting.
Next Up: People
And with that, we're done with the weather aspects of Catheedral. The screenshot below shows the extra radar and satellite icons, and the "tendency" arrow. Coming along nicely, overall.
Next up is the last panel for our home page and we're going to start with tracking people (with their explicit permission of course!). This is something supported directly in Home Assistant, thankfully, as there are a lot of hoops to jump through to get this kind of data. We just have to worry about what we want to display.
We'll also have a look at getting a bit more data out of Home Assistant than we've been getting so far with their WebSocket API. We'll cover the energy-related aspects of the last panel in the post after that.
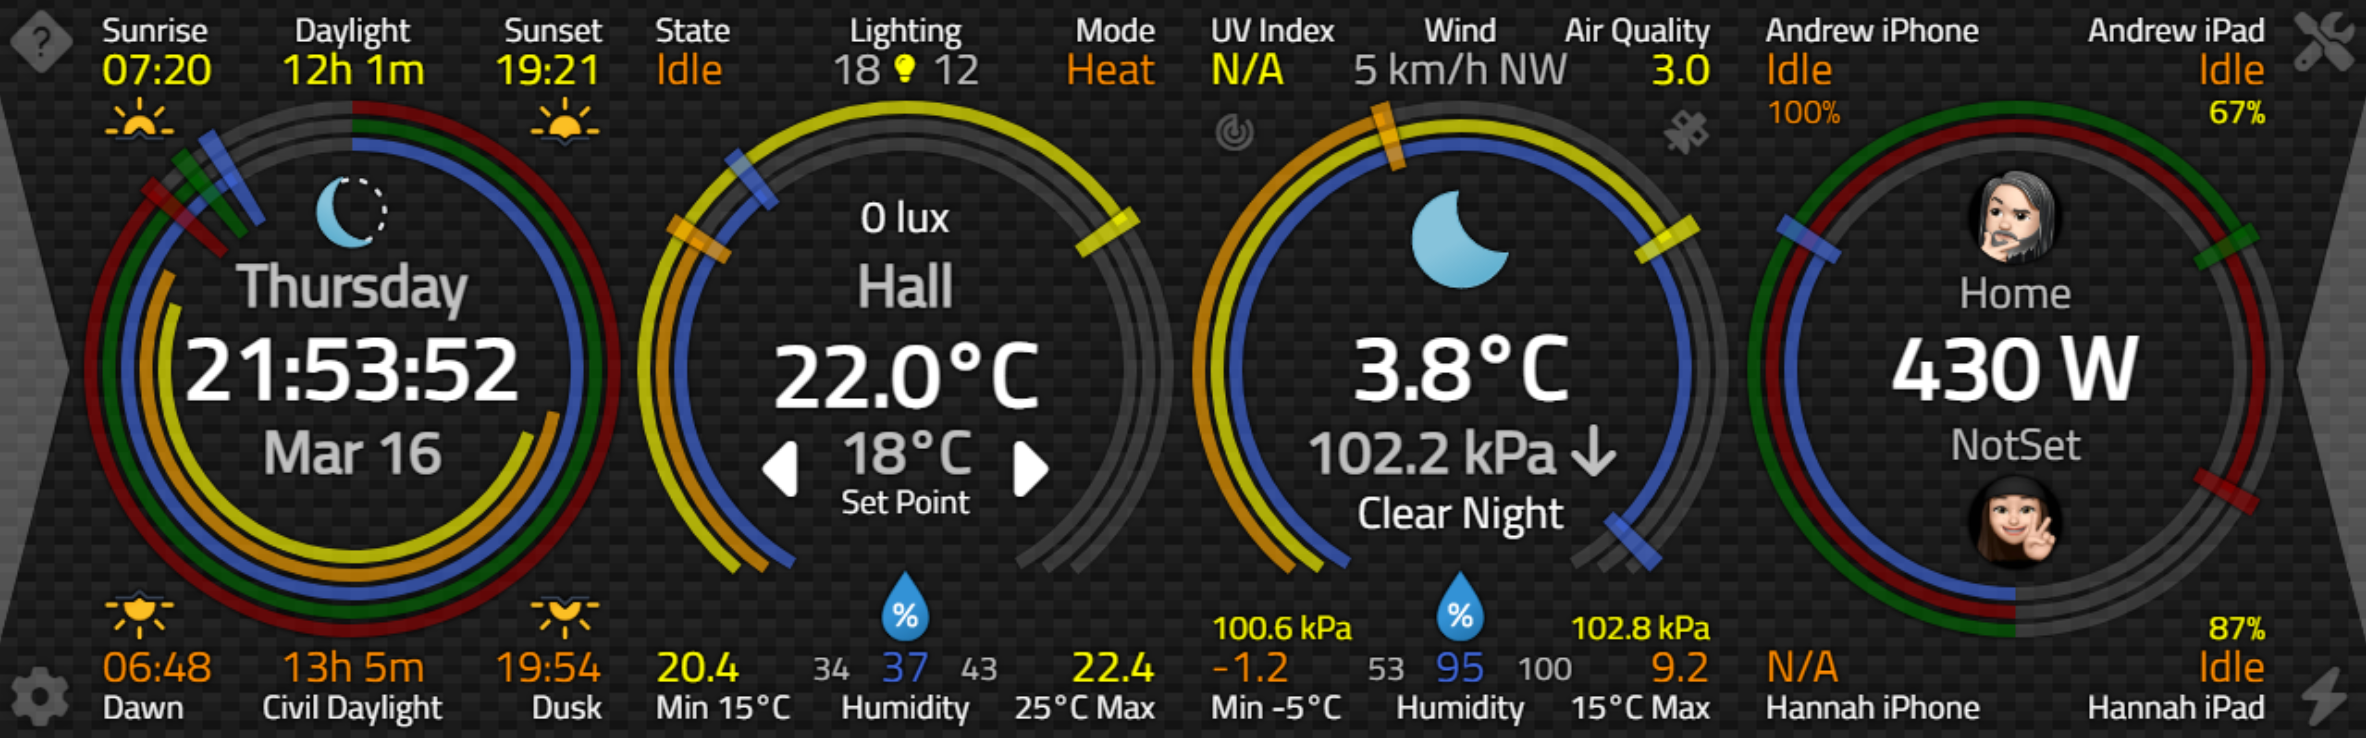
Updated Weather Panel.
So, over to you! Did we miss anything in the weather category? Something you'd really like to have but haven't
seen covered so far? As always, comments and questions are greatly appreciated around these parts.
Catheedral Repository on GitHub
Follow Andrew on 𝕏 at @WebCoreAndMore or join our 𝕏 Web Core and More Community.
Andrew Simard

This blog post has not received any comments yet.
All Blog Posts | Next Post | Previous Post