Blog
All Blog Posts | Next Post | Previous Post

 Custom Cell Rendering in TMS WEB Core TWebDataGrid
Thursday, June 11, 2026

One of the strengths of web development is that a cell in a grid does not need to be limited to plain text. In a modern web application, a cell can be a badge, a progress indicator, a button, a mini dashboard, an image, a chart, or any other piece of HTML that helps the user understand the data faster.
With `TWebDataGrid` in TMS WEB Core v3.0, custom cell rendering brings that same level of flexibility directly to Delphi web applications.
A first introduction with a sample app
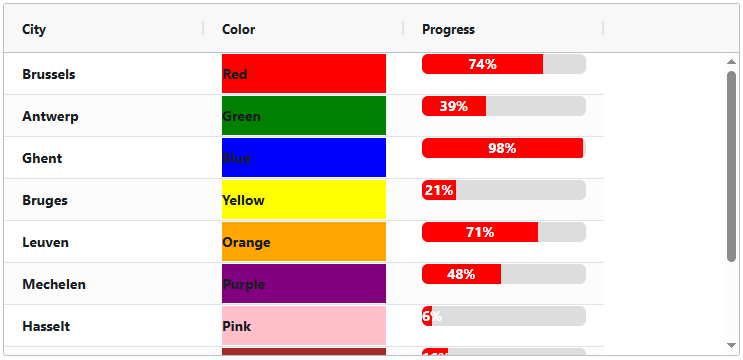
In this sample project created for this blog article, a `TWebDataGrid` is filled with a small list of Belgian cities, color names, and random progress values. The interesting part is not the data itself, but how the grid cells are rendered. Instead of displaying every value as plain text, selected columns use the `OnCustomRender` event to return custom HTML.
The form contains a `TWebDataGrid` with three columns:
- City
- Color
- Progress
The data for the grid is initialized in the form's `OnCreate` event:
procedure TForm2.WebFormCreate(Sender: TObject);
var
  i: integer;
begin
  WebDataGrid1.RowCount := 10;
  for i := 0 to WebDataGrid1.RowCount - 1 do
  begin
    WebDataGrid1.Cells[i, 0] := BelgianCities[i];
    WebDataGrid1.Cells[i, 1] := ColorNames[i];
    WebDataGrid1.Cells[i, 2] := Random(100).ToString;
  end;
end;
The `City` column is rendered as regular text. The `Color` and `Progress` columns each use a custom renderer.
Rendering HTML in a cell
The `Color` column demonstrates the most direct form of custom rendering. The cell value contains a color name, and the renderer returns a `div` with that color as its background via its CSS attribute:
function TForm2.WebDataGrid1Column_column2CustomRender(
  Params: TJSCellRendererParam): TJSValue;
var
  idx: integer;
  clr: string;
begin
  idx := Params.Node.rowIndex;
  clr := string(Params.Value);

  Result := '<div id="row' + idx.ToString + '" style="background-color:'+ clr+'">' + clr + '</div>';
end;
The important detail is that the renderer receives a `TJSCellRendererParam`. Through this parameter, the code has access to information such as the row index and the current cell value. The function then returns HTML as the rendered cell content.
This already opens up many possibilities. A value can be rendered with color, layout, icons, CSS classes, inline styling, or any HTML structure the application needs.
Rendering a progress bar
The `Progress` column takes this one step further. Instead of displaying a numeric value such as `42`, the sample renders a visual progress bar.
First, a helper function generates the HTML for a progressbar based on values between 0 and 100:
function ProgressBarHTML(const AColor: string; AProgress: Integer): string;
begin
  if AProgress < 0 then
    AProgress := 0
  else if AProgress > 100 then
    AProgress := 100;

  Result :=
    '<div style="width:100%;background-color:#ddd;border-radius:6px;overflow:hidden;">' +
      '<div style="width:' + AProgress.ToString + '%;' +
                  'background-color:' + AColor + ';' +
                  'height:20px;' +
                  'text-align:center;' +
                  'color:white;' +
                  'line-height:20px;">' +
        AProgress.ToString + '%' +
      '</div>' +
    '</div>';
end;
The custom renderer for the column then becomes very compact:
function TForm2.WebDataGrid1Column_ProgressCustomRender(
  Params: TJSCellRendererParam): TJSValue;
begin
  Result := ProgressBarHTML('red', integer(Params.Value));
end;
The cell still stores a simple numeric value, but the user sees a clear visual representation. This is exactly where custom rendering becomes useful: the data model can stay simple, while the presentation becomes much richer.
From HTML to JavaScript components
Because the renderer returns HTML, it is not limited to formatting text. A `TWebDataGrid` cell can render virtually anything that can be represented in the browser:
- styled text and badges
- progress bars and status indicators
- action buttons
- images and icons
- custom layouts
- embedded controls
- dynamic HTML generated from row data
The same concept also applies to `TWebDBDataGrid`, making custom rendering equally useful for database-backed grids. Whether the data comes from an in-memory grid or from a dataset, the cell output can be tailored to the application.
Even more importantly, the rendered HTML can work together with JavaScript. This means a cell can become fully dynamic. It can initialize JavaScript widgets, react to user interaction, update its contents, or integrate with existing JavaScript libraries.
Download the Sample
The sample code for this project is available for download. It demonstrates how to assign custom renderers to individual `TWebDataGrid` columns via the OnCustomRender event and how to return HTML from Delphi code for display inside grid cells.
There is also a separate demo showing how to combine `TWebDataGrid` custom rendering with ApexCharts to display sparkline charts in grid cells. This example is included in the TWebDataGrid demos of TMS WEB Core.
Conclusion
Custom cell rendering in `TWebDataGrid` gives Delphi developers direct access to the presentation power of the browser, without leaving the productivity of TMS WEB Core.
From simple colored cells to progress bars, from HTML layouts to JavaScript-powered dynamic content, this feature gives you ultimate flexibility over what appears inside a grid cell. The same approach can be used in both `TWebDataGrid` and `TWebDBDataGrid`, making it useful for a wide range of web applications.
Explore the many capabilities of `TWebDataGrid` in TMS WEB Core v3.0 and see how far you can take modern grid-based web interfaces with Delphi!
Video
Get 10% Off TMS WEB Core & TMS FNC UI Pack
Enjoy 10% off when purchasing a new license of TMS WEB Core or TMS FNC UI Pack. Simply use the promo code WEBDATAGRID10 at checkout.
Offer valid until June 18, 2026
Bruno Fierens
Related Blog Posts
-
Introducing the DB-aware TWebDataGrid
-
Connecting TWebDataGrid & TWebDBDataGrid to Your Data
-
Editing, sorting, filtering and paging in TWeb(DB)DataGrid
-
Dynamic cell style and cell data formatting in TWeb(DB)DataGrid
-
Custom Cell Rendering in TMS WEB Core TWebDataGrid

This blog post has not received any comments yet.
All Blog Posts | Next Post | Previous Post