Blog
All Blog Posts | Next Post | Previous Post

 Visualize your Data Grid information with FNC Chart in Delphi
Thursday, November 21, 2024
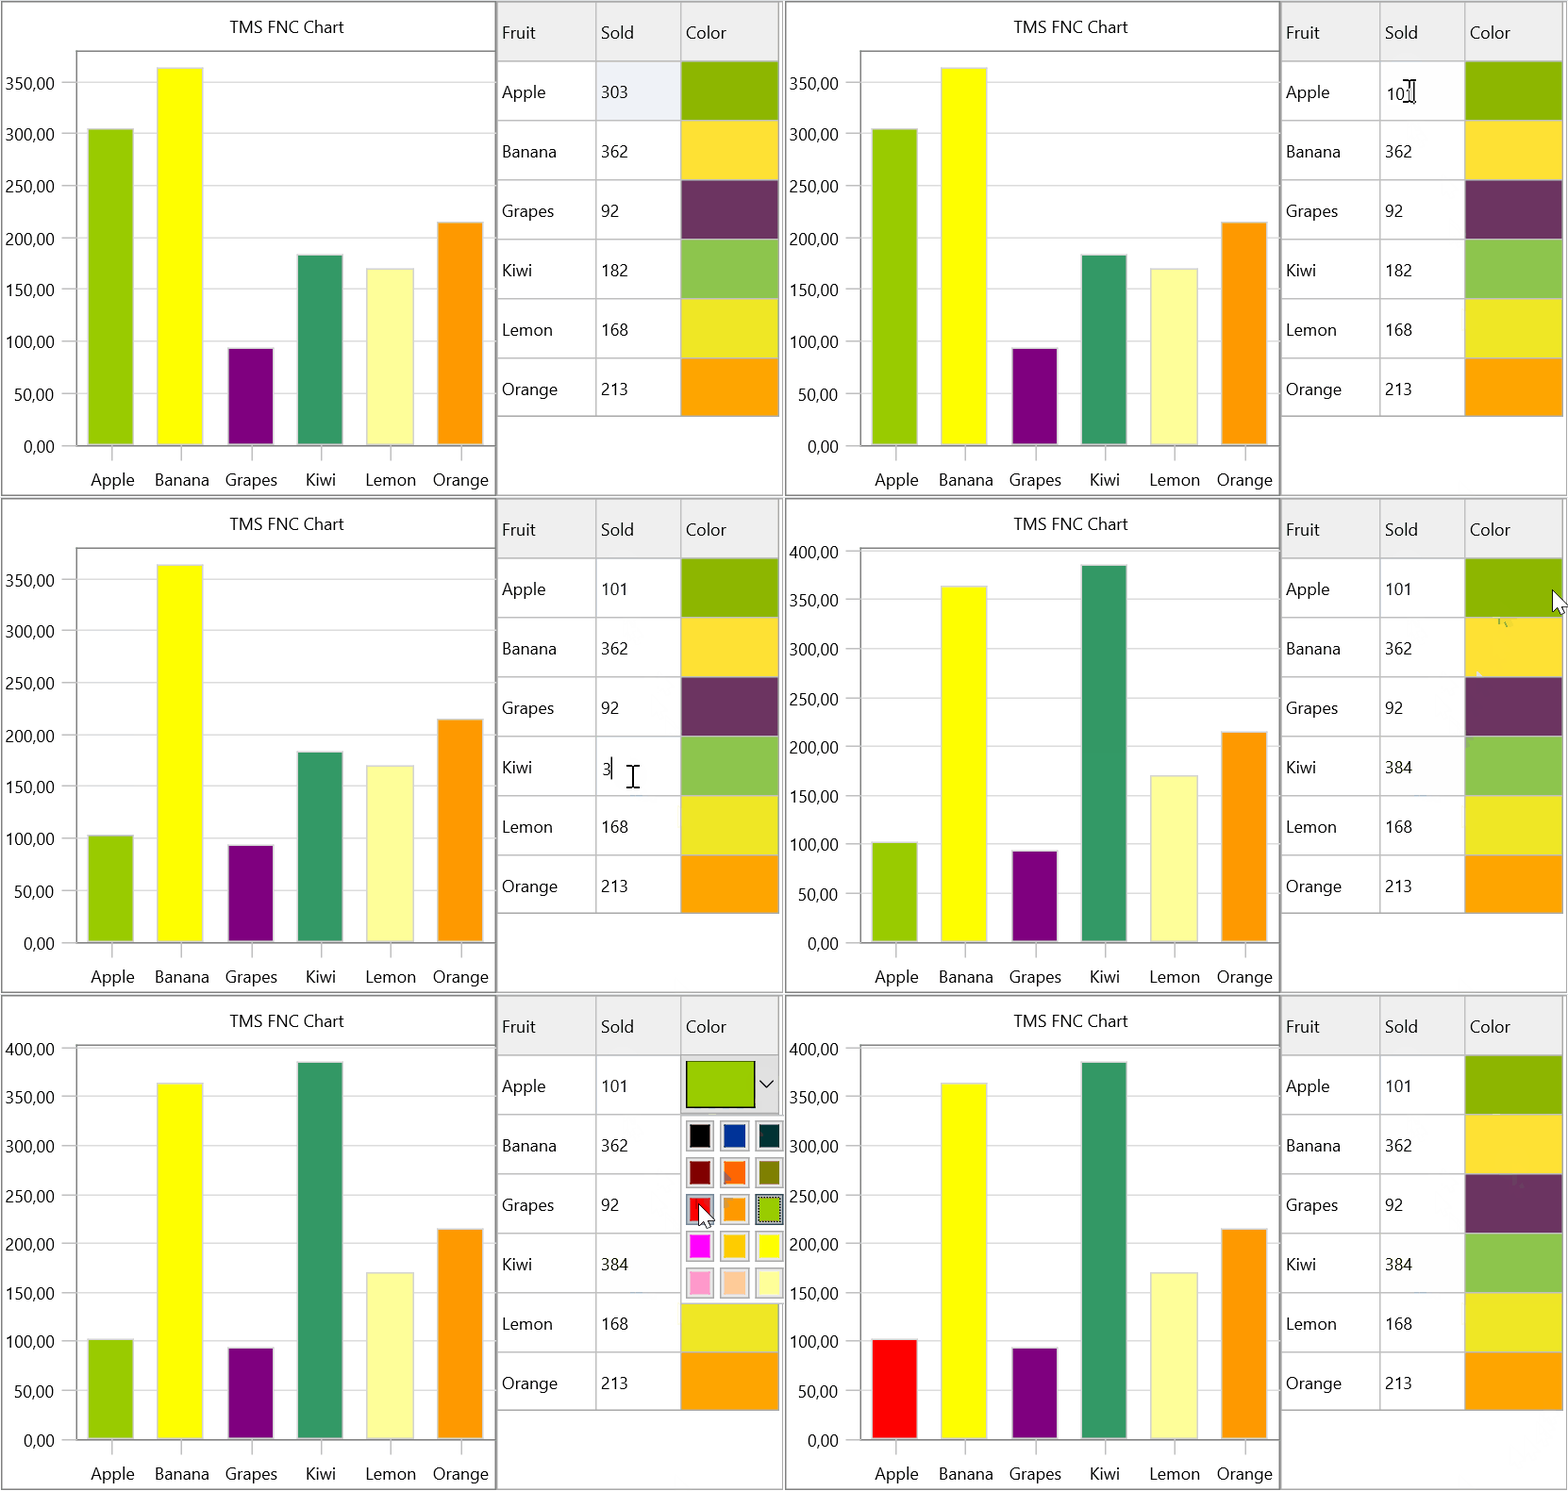
With the latest release of TMS FNC Chart, developers can now easily visualize data in the TMS FNC Data Grid with the help of the TTMSFNCChartDataGridAdapter. This integration allows for the creation of dynamic and visually compelling graphs and charts based on the data within a TMS FNC Data Grid. This functionality requires the TMS FNC UI Pack alongside TMS FNC Chart.
TTMSFNCChartDataGridAdapter: Bringing Your Data to Life

The TTMSFNCChartDataGridAdapter is the central component for connecting TMS FNC Chart to the TMS FNC Data Grid, enabling effortless data synchronization and visualization. Due to dependencies on the TMS FNC UI Pack, their is an additional package in the files that needs to be installed manually.
But if you are using TMS Smart Setup, it will detect when TMS FNC UI Pack and TMS FNC Chart are installed and automatically install the package. (With the instruction "tms install tms.fnc.chartgridadapter".)
Quick Setup Guide
To start using the TMS FNC Chart with TMS FNC Data Grid, follow these steps:
- Add a TTMSFNCChart, a TTMSFNCDataGrid, and a TTMSFNCChartDataGridAdapter to your form.
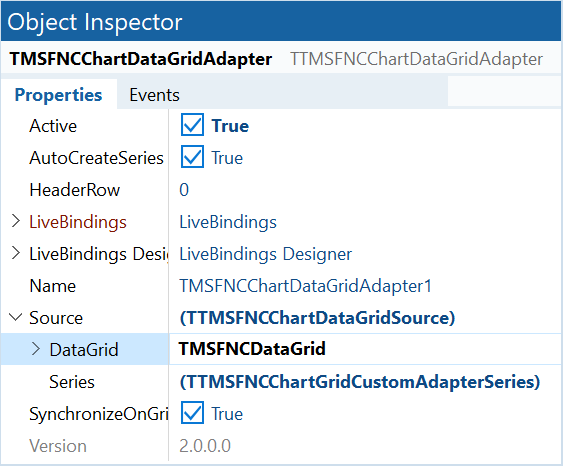
- Link the Adapter property of TTMSFNCChart to TTMSFNCChartDataGridAdapter.
- Set the source of the TMSFNCChartDataGridAdapter to the TMSFNCDataGrid.

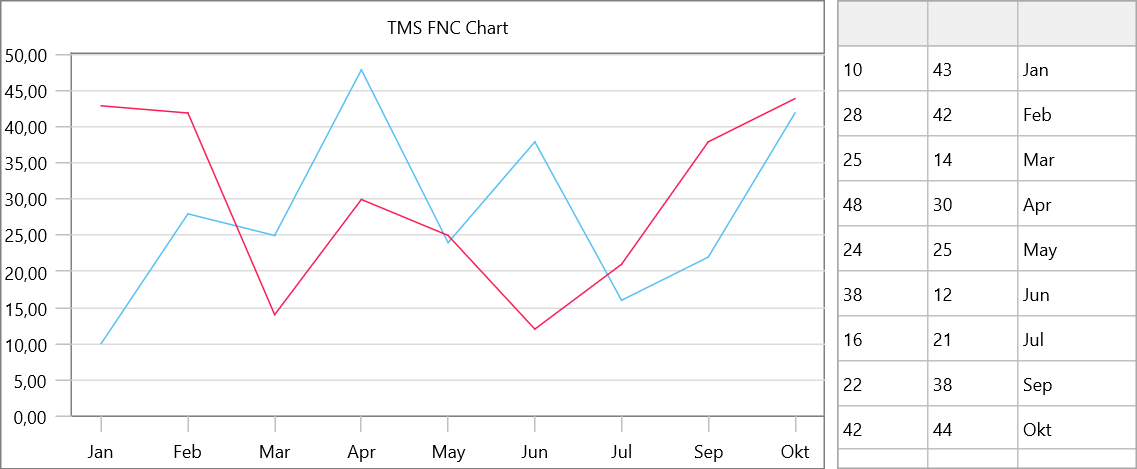
With these simple steps, you can quickly begin visualizing your data. By default, TMSFNCChartDataGridAdapter creates a new series for each column that contains data in the first row. If it detects text in the first row, it uses the first column as the X-axis label.

Customizing Series with TMSFNCChartDataGridAdapterSeries
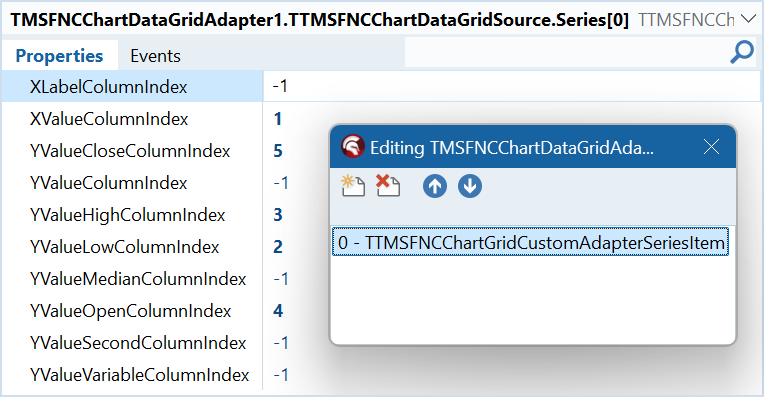
If your data layout is more complex or requires multi-point series, the TMSFNCChartDataGridAdapterSeries collection allows you to define custom series. Set the AutoCreateSeries property of TMSFNCChartDataGridAdapter to False, add a new series item, and specify which columns to use from your TMSFNCDataGrid.

You can also customize data formats; for instance, setting the X-axis format to vftDateTime for date-based data. When editing cells programmatically, call the Synchronize method to refresh the chart with new data.
procedure TForm.FormCreate(Sender: TObject);
begin
  TMSFNCDataGrid.Cells[1,0] := 'Date';
  TMSFNCDataGrid.Cells[2,0] := 'Low';
  TMSFNCDataGrid.Cells[3,0] := 'High';
  TMSFNCDataGrid.Cells[4,0] := 'Open';
  TMSFNCDataGrid.Cells[5,0] := 'Close';

  TMSFNCDataGrid.Cells[1,1] := '7/06/2024';
  TMSFNCDataGrid.Cells[1,2] := '8/06/2024';
  TMSFNCDataGrid.Cells[1,3] := '9/06/2024';
  TMSFNCDataGrid.Cells[1,4] := '10/06/2024';
  TMSFNCDataGrid.Cells[1,5] := '11/06/2024';

  TMSFNCDataGrid.Cells[2,1] := '24.8';
  TMSFNCDataGrid.Cells[2,2] := '23.8';
  TMSFNCDataGrid.Cells[2,3] := '22.8';
  TMSFNCDataGrid.Cells[2,4] := '21.8';
  TMSFNCDataGrid.Cells[2,5] := '20.8';

  TMSFNCDataGrid1.Cells[3,1] := '32.5';
  TMSFNCDataGrid1.Cells[3,2] := '30.2';
  TMSFNCDataGrid1.Cells[3,3] := '34.6';
  TMSFNCDataGrid1.Cells[3,4] := '30.2';
  TMSFNCDataGrid1.Cells[3,5] := '33.7';

  TMSFNCDataGrid.Cells[4,1] := '27.3';
  TMSFNCDataGrid.Cells[4,2] := '25.3';
  TMSFNCDataGrid.Cells[4,3] := '28.0';
  TMSFNCDataGrid.Cells[4,4] := '30.1';
  TMSFNCDataGrid.Cells[4,5] := '30.0';

  TMSFNCDataGrid.Cells[5,1] := '25.3';
  TMSFNCDataGrid.Cells[5,2] := '28.1';
  TMSFNCDataGrid.Cells[5,3] := '30.2';
  TMSFNCDataGrid.Cells[5,4] := '30.2';
  TMSFNCDataGrid.Cells[5,5] := '24.6';

  TMSFNCChart.DefaultLoadOptions.XValuesFormatType := vftDateTime;

  TMSFNCChartDataGridAdapter.Synchronize;
end;
In the Synchronized event, you can further customize the chart, such as setting specific chart types:
procedure TForm.TMSFNCChartDataGridAdapterSynchronized(Sender: TObject);
begin
  TMSFNCChart.Series[0].ChartType := ctCandleStick;
  TMSFNCChart.Series[0].MinXOffsetPercentage := 10;
  TMSFNCChart.Series[0].MaxXOffsetPercentage := 10;
end;

Events for Customized Data Handling
For more granular control over how grid data is represented in the chart, TMS FNC Chart provides events. For example, you can use the SetColumnValueType event to designate certain columns as X-axis labels or exclude columns from the series.
// Example data
procedure TForm.FormCreate(Sender: TObject);
begin
  TMSFNCDataGrid.Cells[1,0] := 'Prod-Num';
  TMSFNCDataGrid.Cells[2,0] := 'Product';
  TMSFNCDataGrid.Cells[3,0] := 'Price';
  TMSFNCDataGrid.Cells[4,0] := 'Volume';
  TMSFNCDataGrid.Cells[5,0] := 'Color';

  TMSFNCDataGrid.Cells[1,1] := 'CA-J-123.45';
  TMSFNCDataGrid.Cells[1,2] := 'CA-S-155.78';
  TMSFNCDataGrid.Cells[1,3] := 'CA-S-267.36';
  TMSFNCDataGrid.Cells[1,4] := 'CA-D-102.10';
  TMSFNCDataGrid.Cells[1,5] := 'CA-S-403.48';

  TMSFNCDataGrid.Cells[2,1] := 'Jeans';
  TMSFNCDataGrid.Cells[2,2] := 'Shirts';
  TMSFNCDataGrid.Cells[2,3] := 'Sweaters';
  TMSFNCDataGrid.Cells[2,4] := 'Dresses';
  TMSFNCDataGrid.Cells[2,5] := 'Shoes';

  TMSFNCDataGrid.Cells[3,1] := '48.99';
  TMSFNCDataGrid.Cells[3,2] := '26.99';
  TMSFNCDataGrid.Cells[3,3] := '34.99';
  TMSFNCDataGrid.Cells[3,4] := '49.99';
  TMSFNCDataGrid.Cells[3,5] := '64.99';

  TMSFNCDataGrid.Cells[4,1] := '1856';
  TMSFNCDataGrid.Cells[4,2] := '2223';
  TMSFNCDataGrid.Cells[4,3] := '1668';
  TMSFNCDataGrid.Cells[4,4] := '846';
  TMSFNCDataGrid.Cells[4,5] := '912';

  TMSFNCDataGrid.Cells[5,1] := '#FCEC7F';
  TMSFNCDataGrid.Cells[5,2] := '#FC7FCE';
  TMSFNCDataGrid.Cells[5,3] := '#FCAD7F';
  TMSFNCDataGrid.Cells[5,4] := '#7FFCAD';
  TMSFNCDataGrid.Cells[5,5] := '#7FCEFC';

  TMSFNCChartGridAdapter.Synchronize;
end;
procedure TForm1.TMSFNCChartGridAdapterSetColumnValueType(Sender: TObject;
  AColumn: Integer; ACell: string; var AValueType: TTMSFNCChartPointValueType);
begin
  if AColumn = 2 then
    AValueType := cvtXLabel
  else if AColumn = 3 then
    AValueType := cvtNone;
end;procedure TForm1.TMSFNCChartGridAdapterRowToPoint(Sender: TObject; ARow: Integer; ASeries: TTMSFNCChartSerie; APoint: TTMSFNCChartPoint); begin APoint.Color := TTMSFNCGraphics.HTMLToColor(TMSFNCDataGrid.Cells[5, ARow]); end;
Conclusion
The TMS FNC Chart integration with TMS FNC Data Grid via TTMSFNCChartDataGridAdapter transforms data from grid cells into compelling visualizations. The enhanced customization options make it simple to adapt the visualization to suit various data layouts and application needs.
Gjalt Vanhouwaert

This blog post has received 2 comments.

 2. Sunday, November 24, 2024 at 10:51:52 AM
Hi,
2. Sunday, November 24, 2024 at 10:51:52 AM
Hi,Unfortunately no, there is some core functionality in TMS WEB Core missing that requires our attention. We are currently working hard to support WEB as well. You can expect some data grid changes for TMS WEB Core soon.
Pieter Scheldeman
All Blog Posts | Next Post | Previous Post

Does it already work on TMS Web Core too?
Monterisi Stefano