Blog
All Blog Posts | Next Post | Previous Post

 Chart Logarithmic Scale & Crosshairs in Delphi
Thursday, September 29, 2022
A while ago, we released TMS FNC Chart v2.0. This major milestone brought a couple of highly awaited new features. Today, we are proud to announce the release of v2.5. This new version brings 2 new features: Logarithmic Scale and Crosshairs.
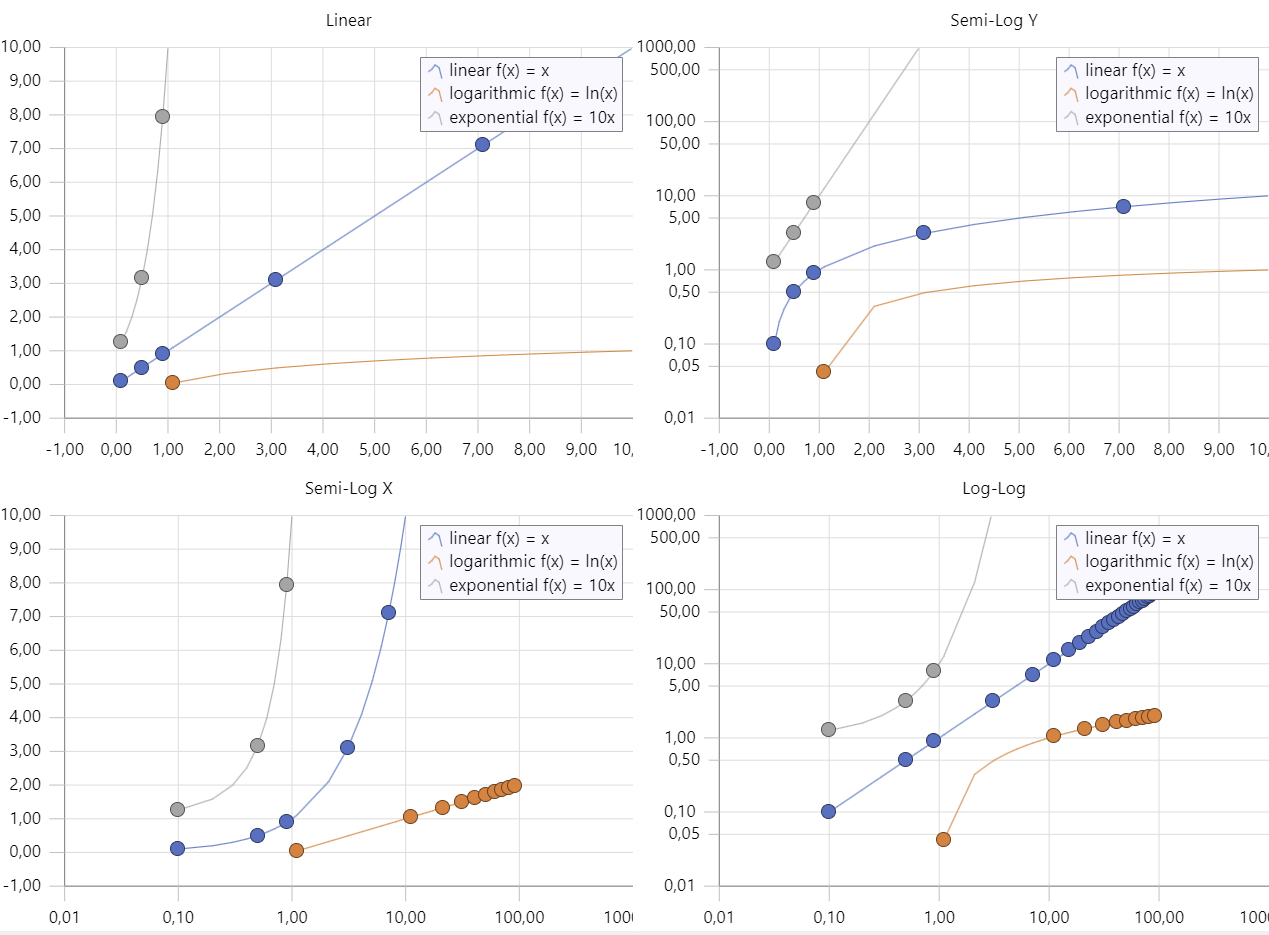
Logarithmic Scale
With Logarithmic scale support we add the ability to visualize data with large differences between the minimum and maximum value in a compact way. The following modes are supported:
- Semi-Log X
- Semi-Log Y
- Log-Log (both X and Y are logarithmic)
To get started, set the LogarithmicX and/or LogarithmicY properties to true at series level.
TMSFNCChart1.Series[0].LogarithmicX := True;
TMSFNCChart1.Series[0].LogarithmicY := True;
The base number is 10, to change the number, use the properties LogarithmicXBase or LogarithmicYBase.
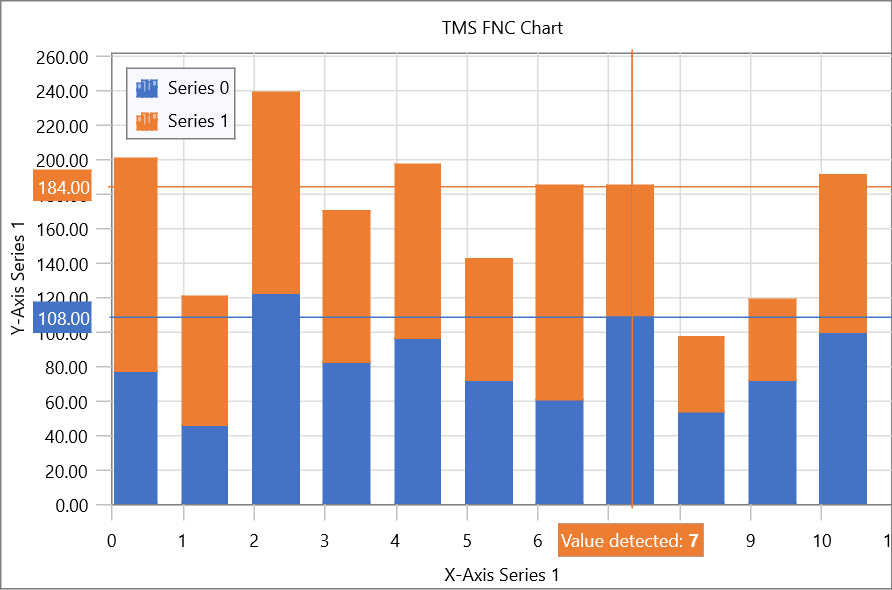
Crosshairs
With support for crosshairs, we add the ability to hover the chart and detect which values are close to the mouse pointer. There are 2 modes available that can be used separately or simultaneously.
- Continuous: Displays the X & Y value matching the X, Y coordinate of the mouse pointer.
- Point Based: Displays the X & Y value from the closest point to the X, Y coordinate of every series.
There are several configuration options to show/hide crosshairs per series, change the appearance and even customize the drawing via events. By default, the formatting of the values follow the XValues and YValues property settings.
Availability?
TMS FNC Chart v2.5 is available today! So go ahead and download the latest version. Included are 2 new demos available after updating.
Feedback is important!
The above result is based on feedback, your feedback. Sending us suggestions for new features, shortcomings & ideas to improve our products overall are always appreciated. We analyze the feedback and see what is feasible and in which time frame. Then we go ahead and assign a team of experienced developers to the task, which always results in the best possible implementation. Have some ideas? don't hesitate to contact us and/or leave a comment below.
Pieter Scheldeman

This blog post has received 2 comments.
 2. Friday, September 30, 2022 at 11:56:33 AM
It''s possible to define your own range (minimum and maximum), but the grid lines will be at a minimum of 1 for the major unit which means that although visually the grid starts at 0.55, the first major tickmark/gridline will start at 1. For the minor tickmarks, you can choose the unit yourself.
2. Friday, September 30, 2022 at 11:56:33 AM
It''s possible to define your own range (minimum and maximum), but the grid lines will be at a minimum of 1 for the major unit which means that although visually the grid starts at 0.55, the first major tickmark/gridline will start at 1. For the minor tickmarks, you can choose the unit yourself.procedure TForm5.FormCreate(Sender: TObject);
var
s: TTMSFNCChartSerie;
begin
TMSFNCChart1.BeginUpdate;
s := TMSFNCChart1.Series[0];
s.AutoYRange := arDisabled;
s.LogarithmicY := True;
s.MinY := 0.55;
s.MaxY := 120;
s.MaxYOffsetPercentage := 0;
s.YValues.AutoUnits := False;
s.YValues.MajorUnit := 1;
s.YValues.MinorUnit := 0.1;
TMSFNCChart1.EndUpdate;
end;
Pieter Scheldeman
All Blog Posts | Next Post | Previous Post
We already have this in our own custom written graph component, but if we wanted to transition to the FNC chart (which is a possibility), it would have to have this feature available.
Also we need the grids to show the other intermedfiate value within a decade (i.e. Major lines at 1.0 and 10.0, and minor grid lines at 2.0, 3.0, 4.0, 5.0, 6.0. 7.0, 8.0, 9.0)
Dave Martel