VCL
TMS VCL Chart
DB-aware and non DB-aware feature-rich charting components for business, statistical, financial & scientific data
For Windows VCL and FMX development we recommend using
FNC Framework Benefits
- Full compatibility with VCL, FMX and TMS WEB Core
- Single high-performance multi-platform codebase
- Easily extendible with many customization options/events
- High performance, high quality graphics
- Enhanced design-time integration
Feature overview
 Click image for more screenshots.
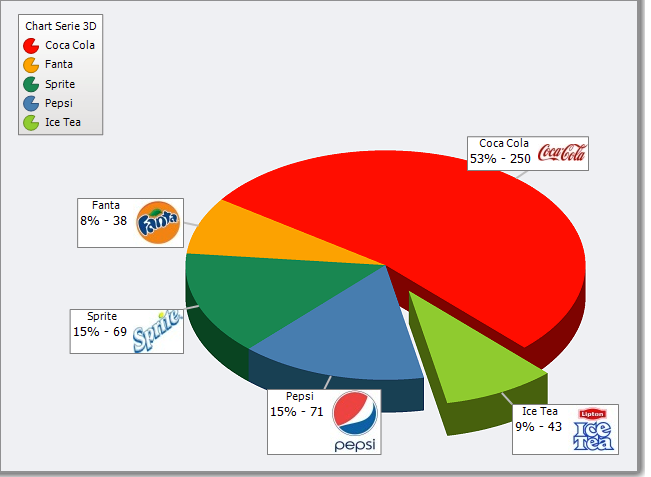
TAdvChartView & TDBAdvChartView : fast multi-pane & DB-aware chart component
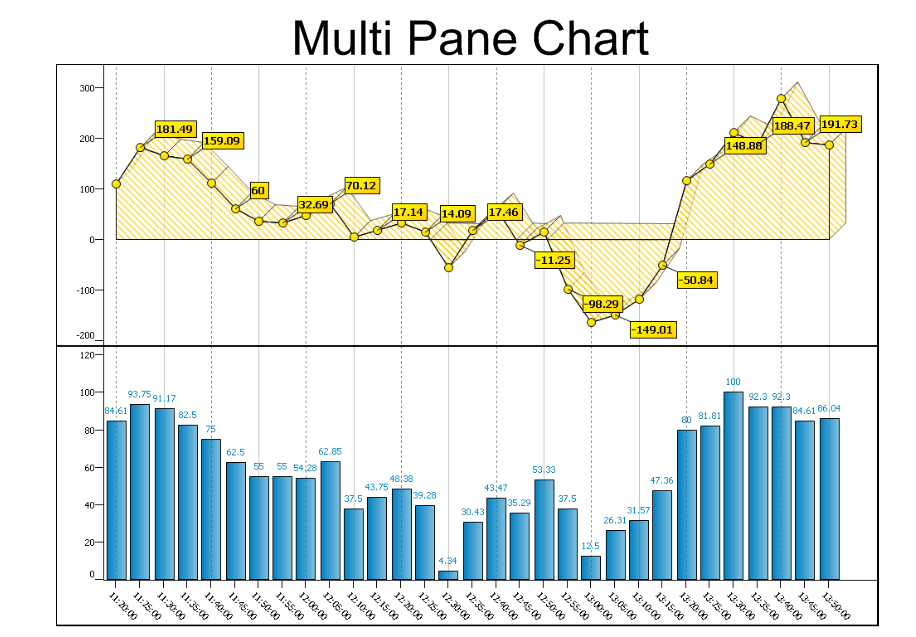
- Single or multi pane chart view component
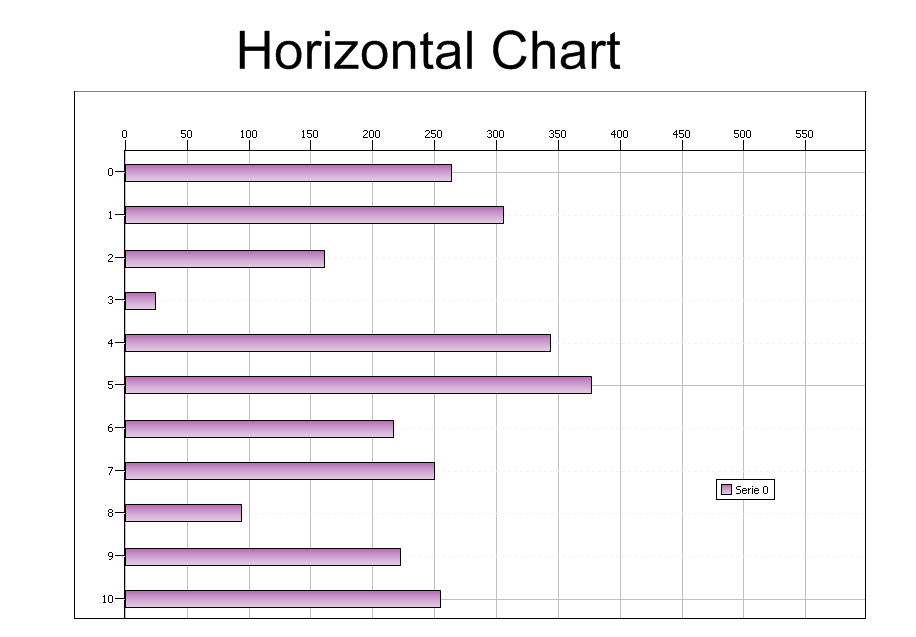
- Vertical or horizontal oriented charts
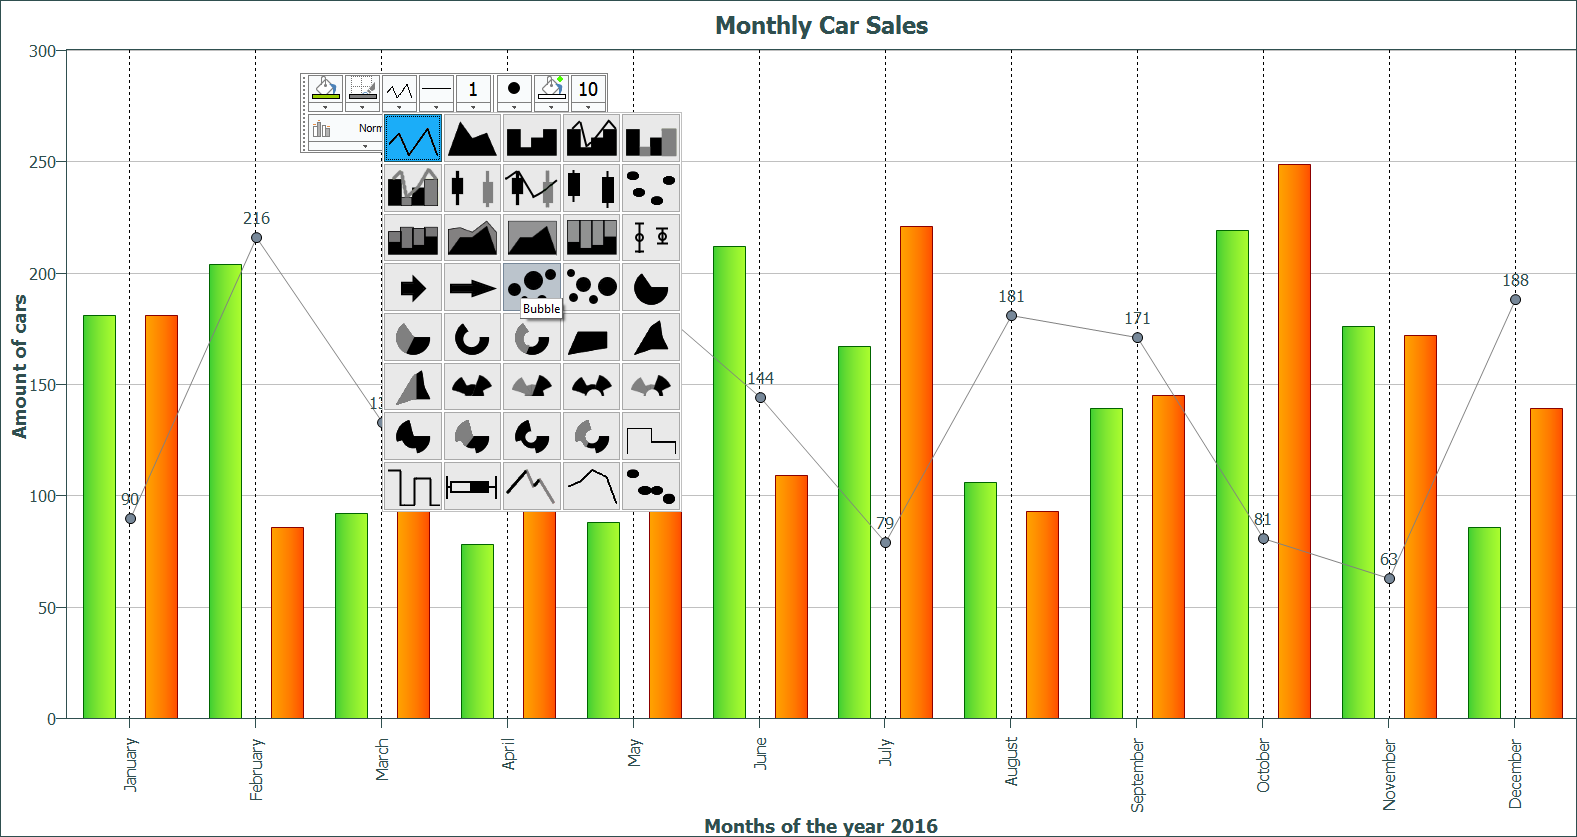
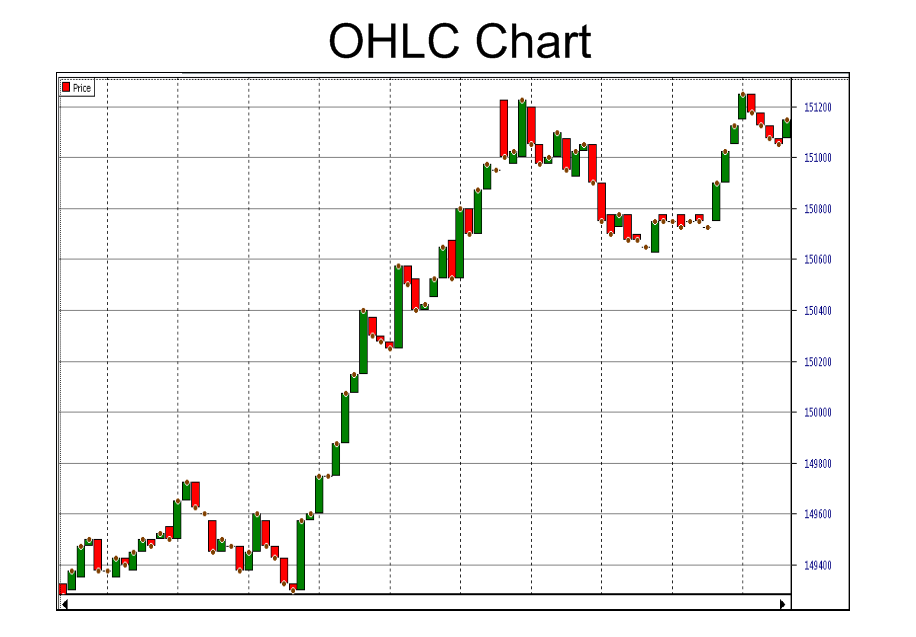
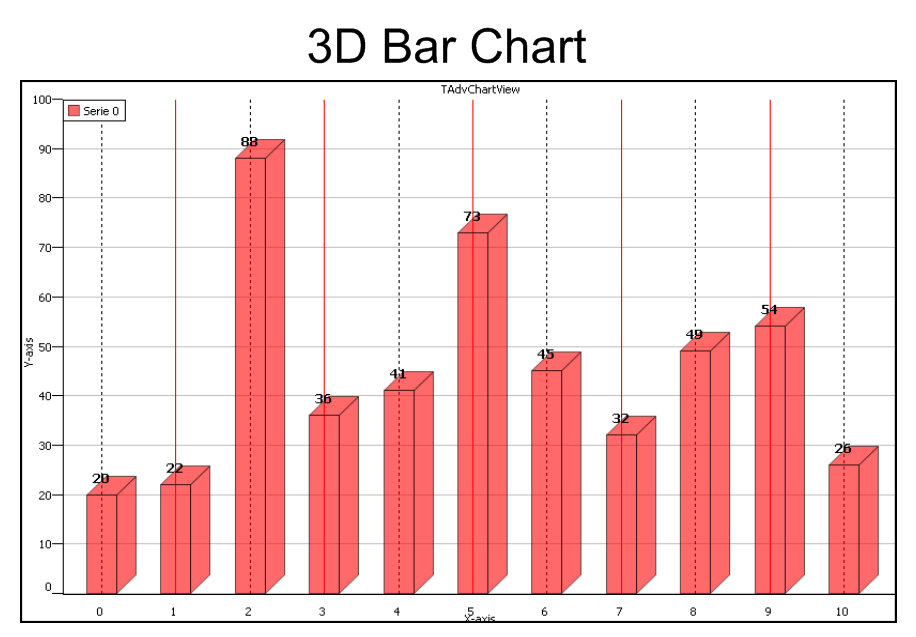
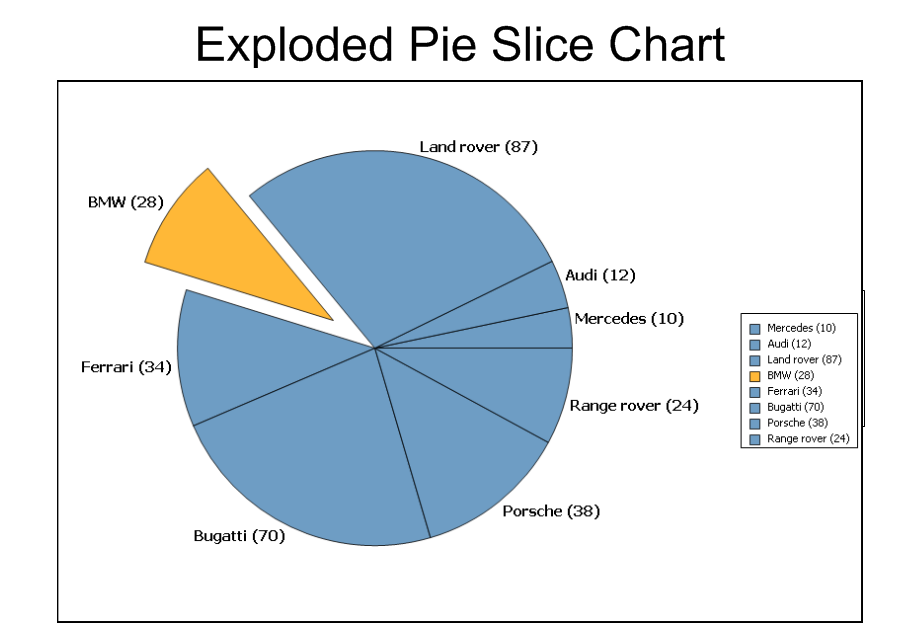
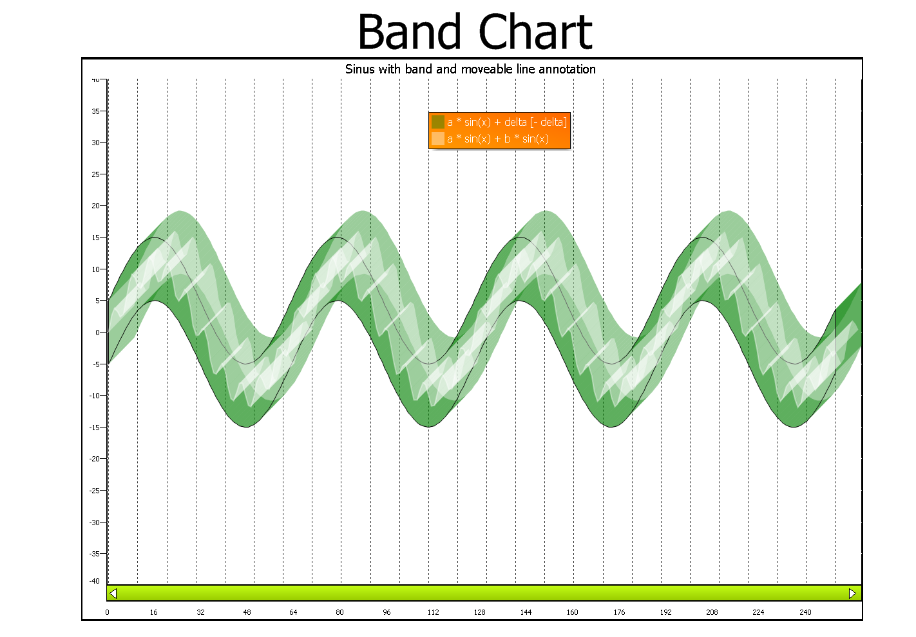
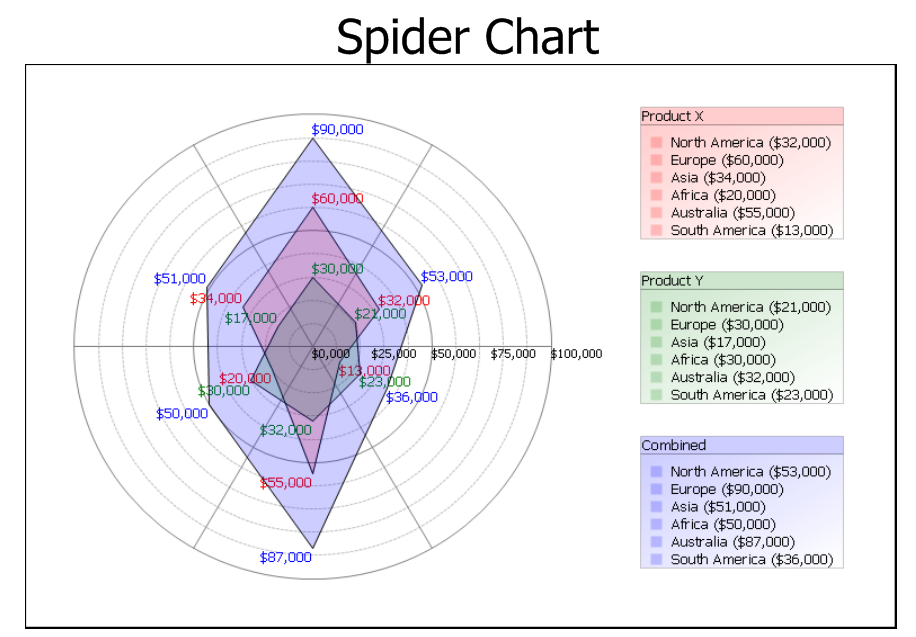
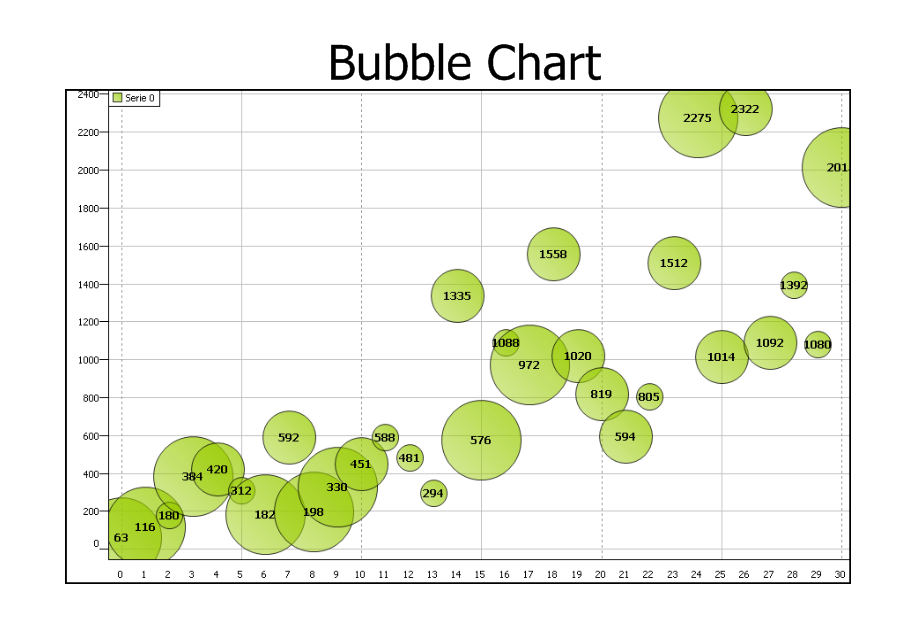
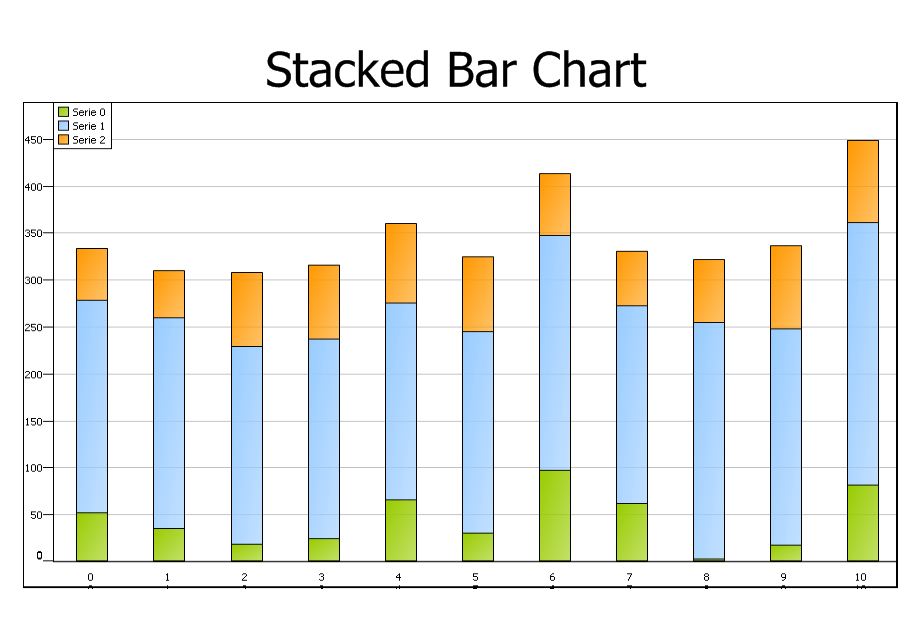
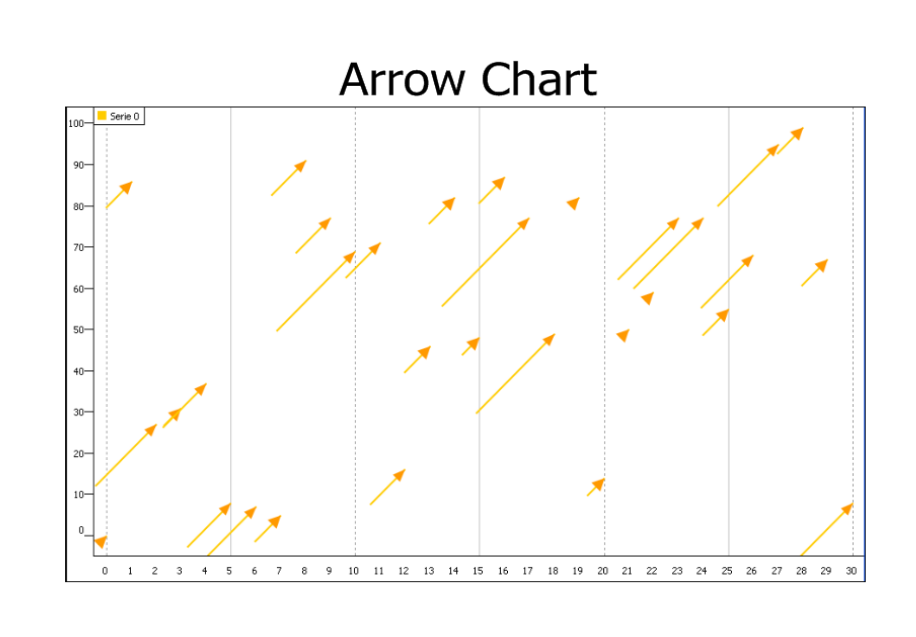
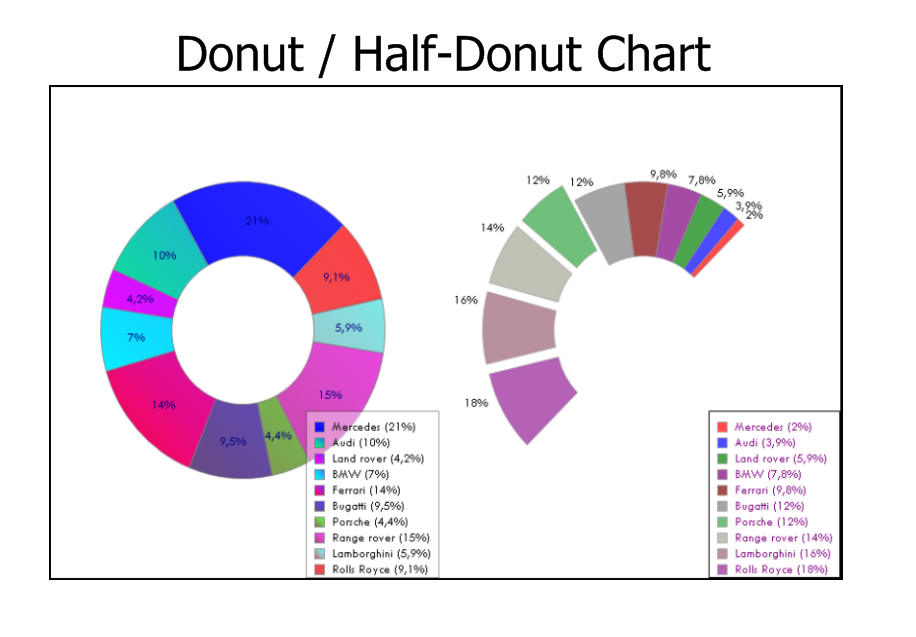
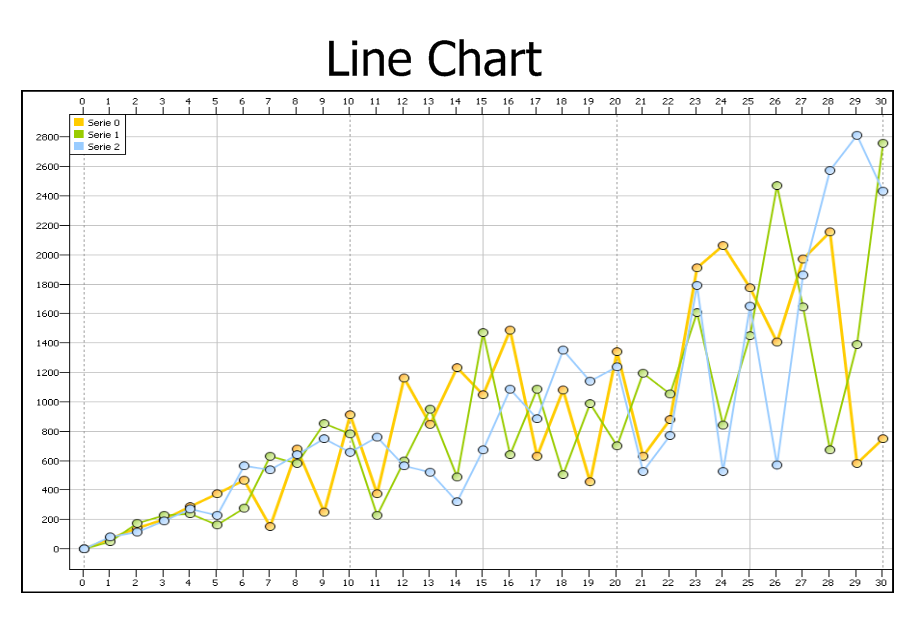
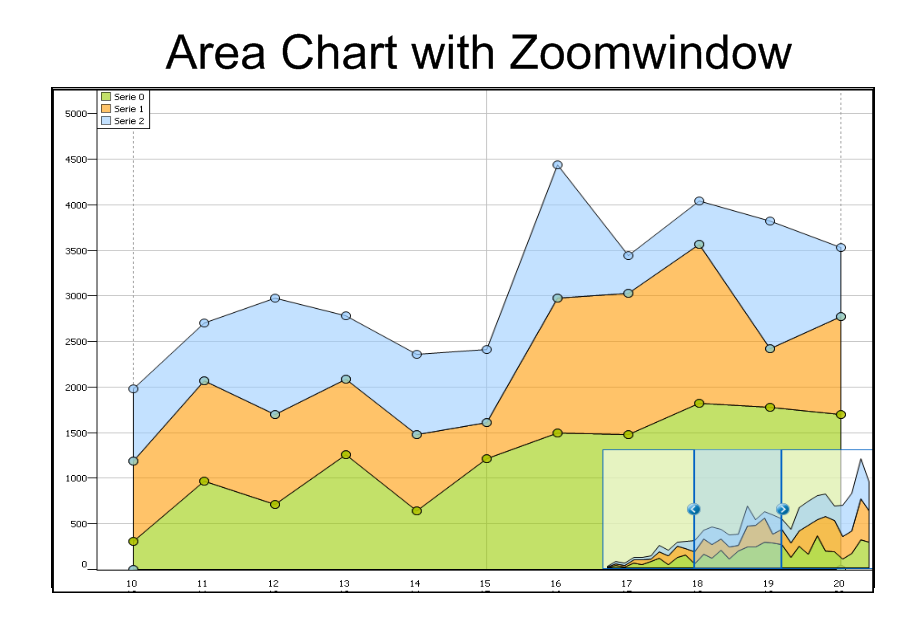
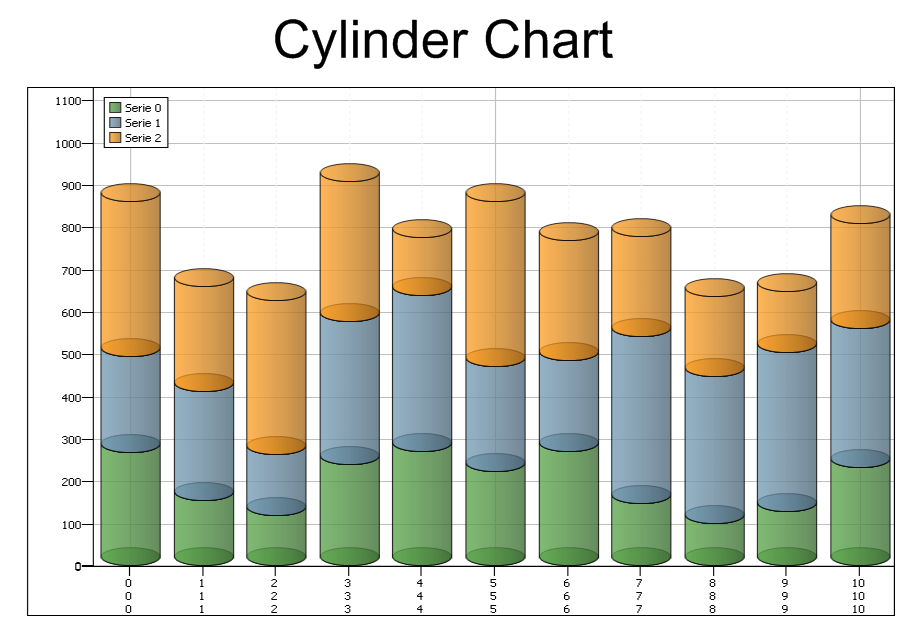
- Wide range of chart types: Line, Bar, Area, Pie, Spider, Donut, Band, Stacked Bars, Stacked Area, OHLC, CandleStick, Histogram, Bubble, Error, Digital Line, Funnel ...
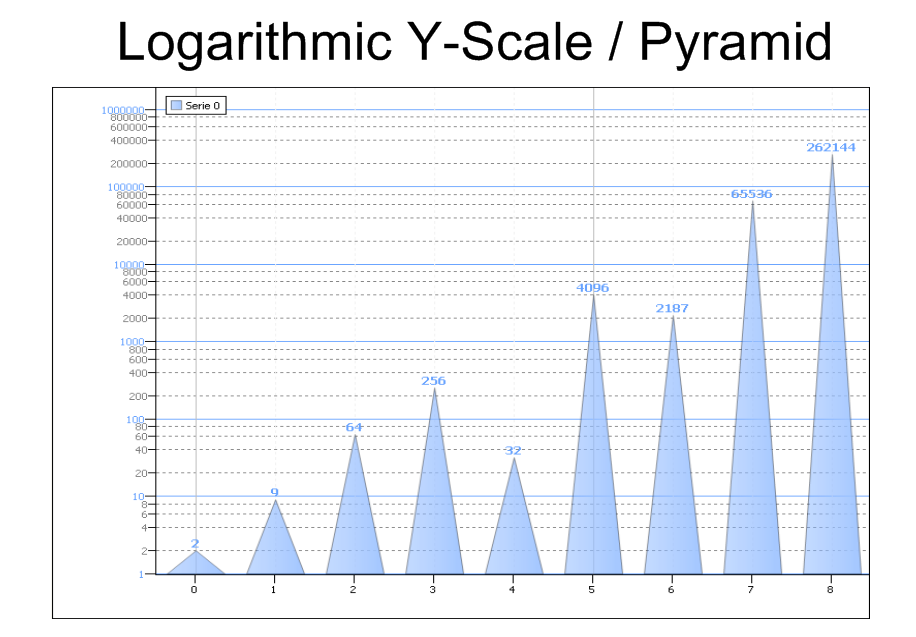
- Different bar shapes such as rectangle, cylinder and pyramid
- X-axis with index of date/time unit indication
- Linear or logarithmic Y-scale
- Y-axis with auto ranging, minor & major value indication along Y-axis, multiple Y-axis values for different series supported
- Support for annotations & legend
- Panes with scrolling, scaling, splitter, drag & drop, synchronized scrolling with mouse or keyboard
- Highly configurable crosshairs with value indication at series, Y-axis, tracker & crosshair support along multiple panes
- Navigator bar to help for scrolling series along X-axis
- Floating tracker window to see values at crosshairs
- Configurable grid & bands
- Configurable margins for chart & chart background image
- Printing support, export to bitmap support
- Support for persisting chart settings to file
- Interface component to synchronise automatically with TAdvStringGrid / TDBAdvGrid
- DB-aware panes and series
- Includes TAdvChartViewPDFIO component to export Chart to PDF
- Includes popup toolbar to configure series visuals (XE2 and newer)
TAdvGDIPChartView & TDBAdvGDIPChartView : GDI+ enabled multi-pane &
DB-aware chart component
- Advanced GDI+ enabled version of TAdvChartView
- Anti-aliased chart drawing
- Complex gradient support
- Support charts with opacity & opacity gradients
- Support for PNG images with alpha transparency for chart markers, textures
- GDI+ hatches for chart fills
- Shadows on bars, lines, areas, legend
- Optional glass mirror effect support
- Zoom control window with full scroll range
- Export charts to .PNG, .JPEG, .GIF, .TIFF or .BMP files
- Includes TAdvChartViewPDFIO component to export Chart to PDF
TAdvChartView3D : OpenGL 3D multi-serie chart component
- High Quality OpenGL 3D Rendering
- Optional AntiAliasing
- Multiple Series
- Pie Chart Type
- Mouse Interaction
- Export to image
- Configurable values with optional image
- Configurable legend & title
- 3D rotation support on X, Y and Z-Axis
Additional tools and information
Automatically connect TAdvStringGrid to TAdvChartView with TAdvChartLink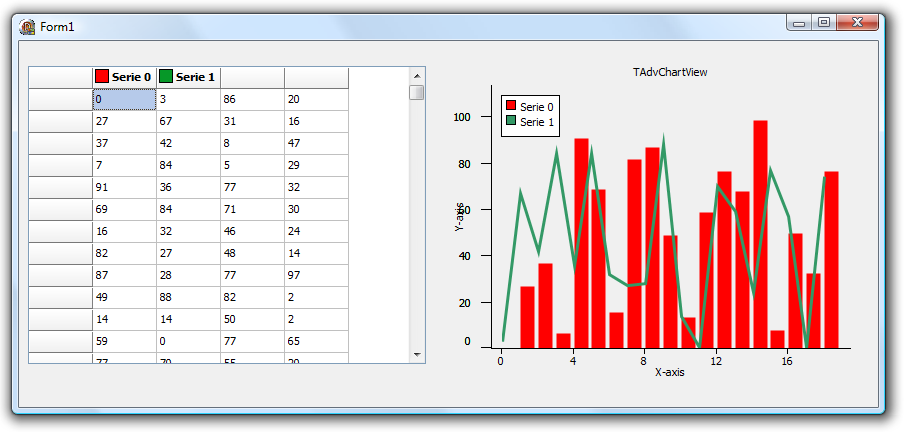
Some sample screenshots of user applications ...
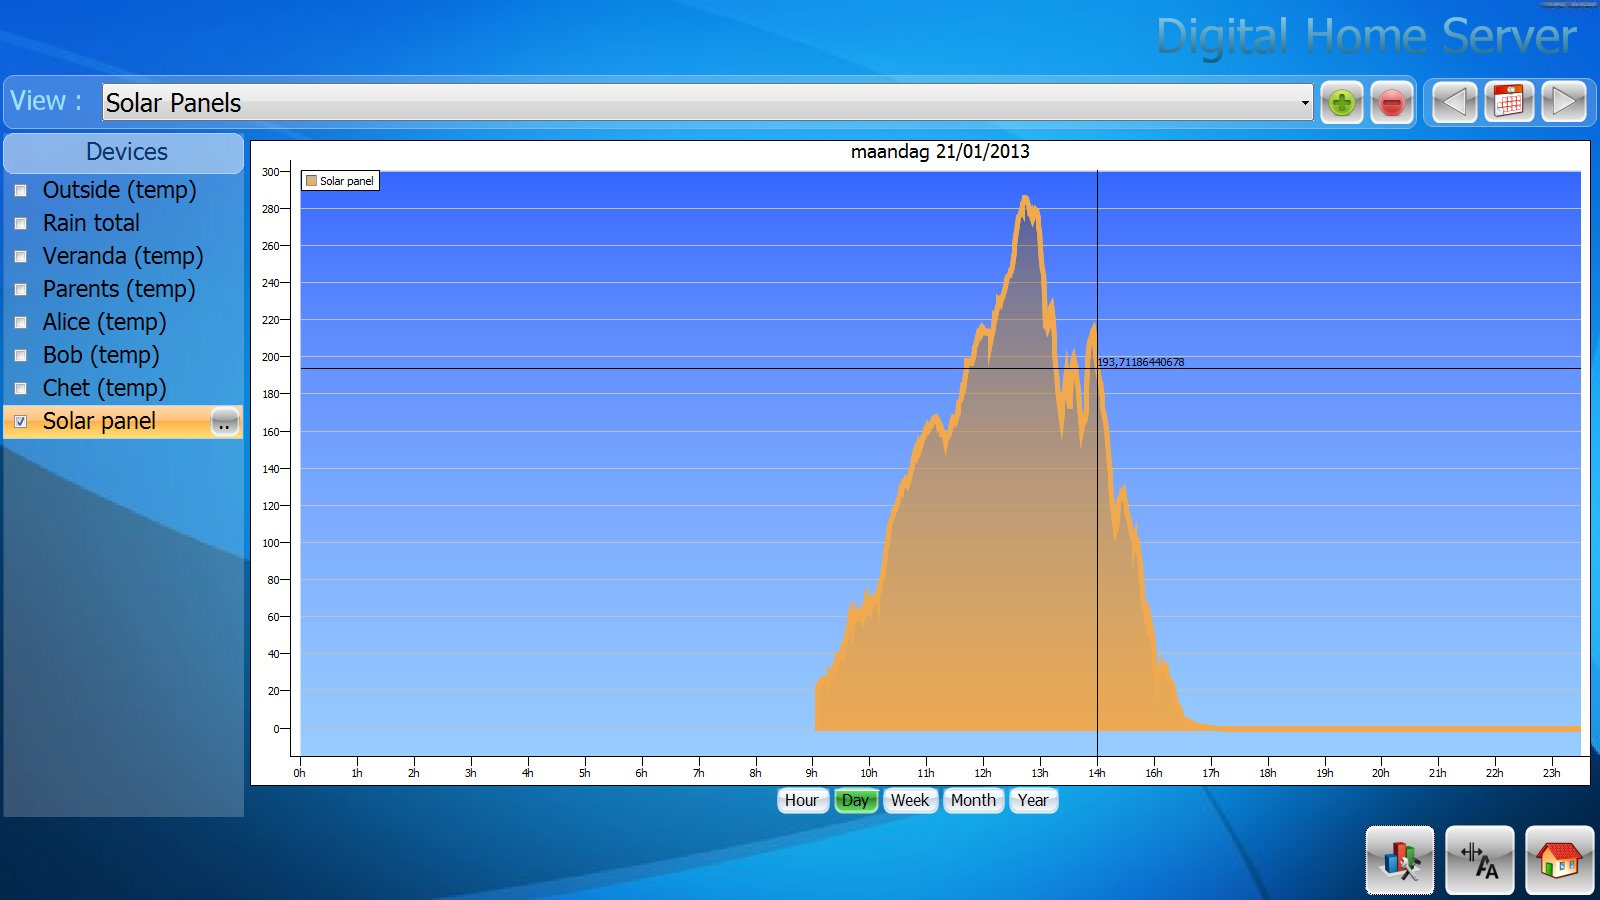
Home automation and multimedia application by DHS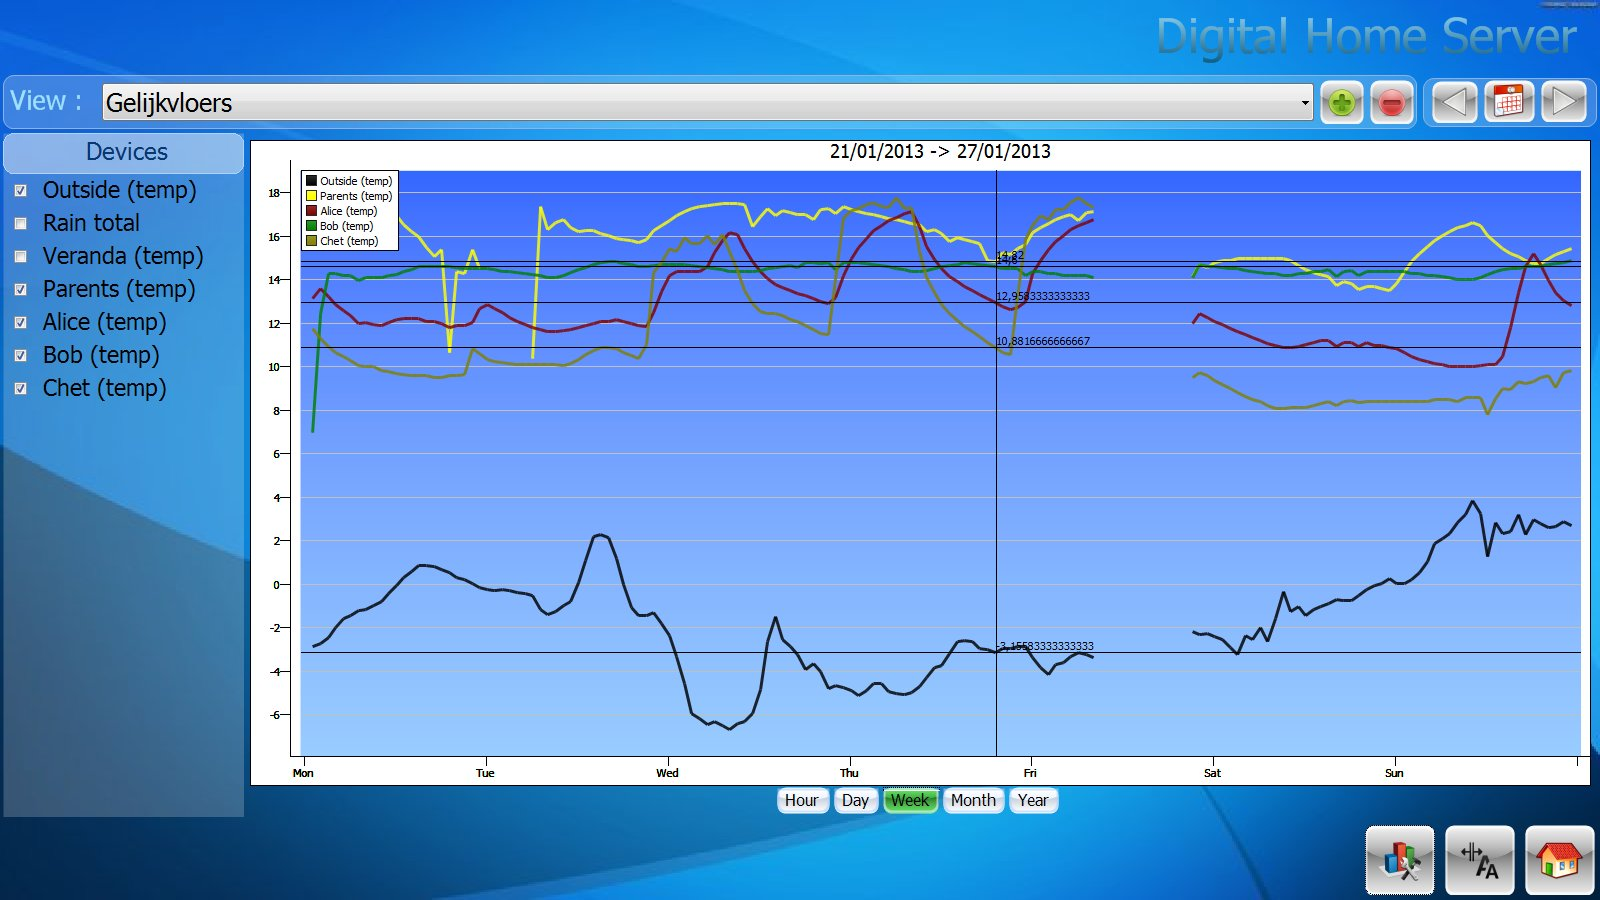 Click image for more screenshots.
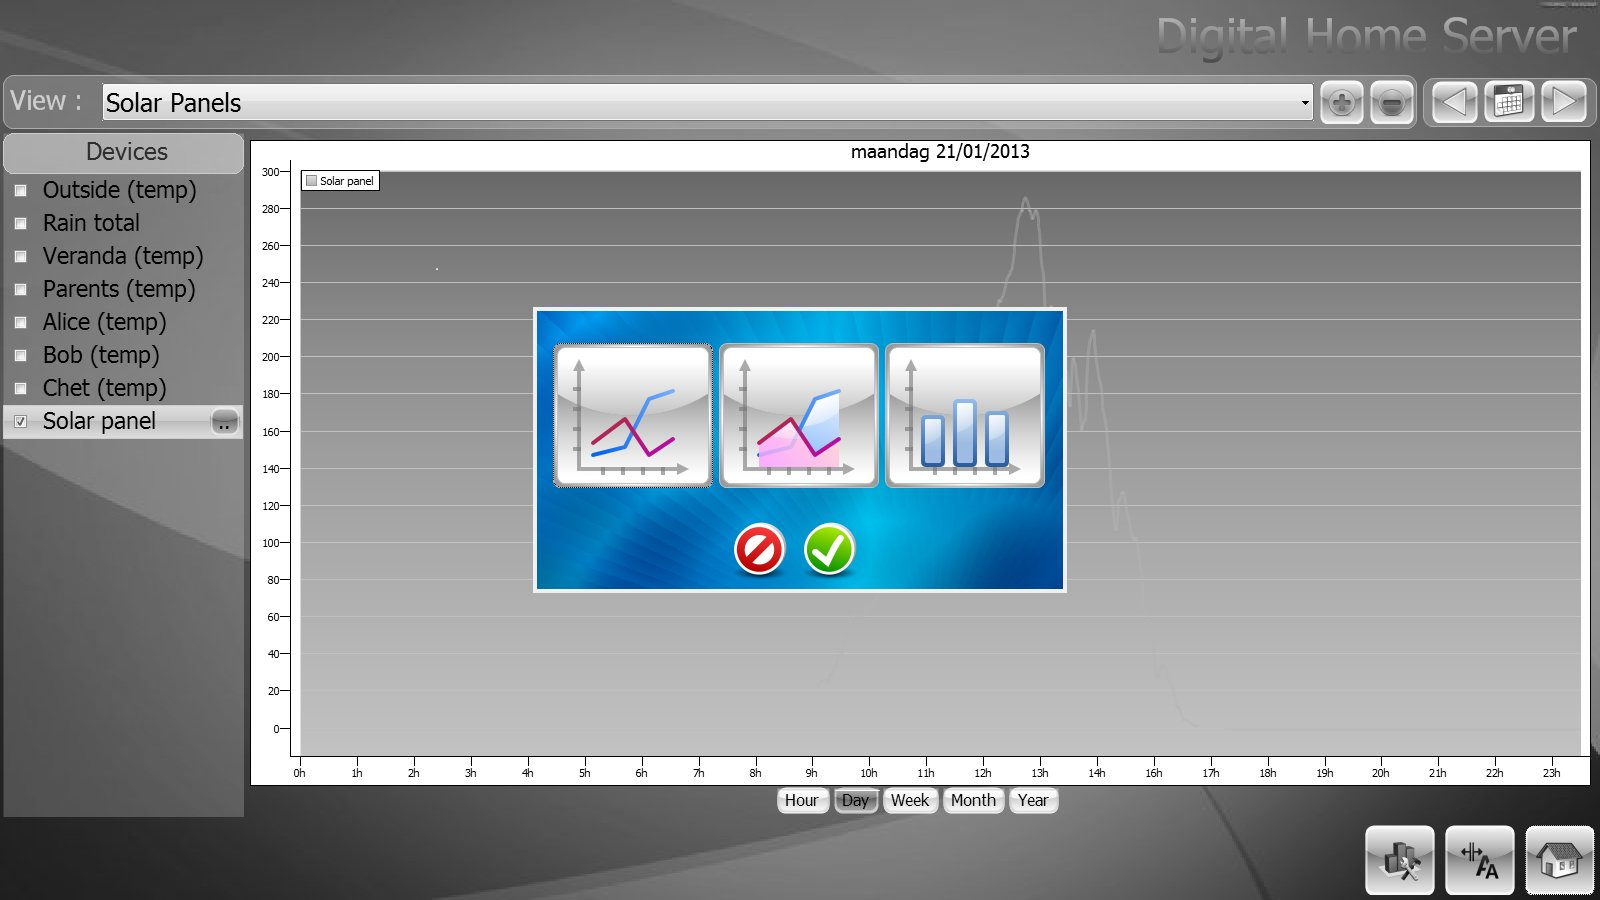
Pricing
Single Developer License
Small Team License
Site License
TMS VCL Chart
€ 125
€
70
yearly renewal
license for 1 developer
Includes
check
Full source code
check
Access to the TMS Support Center
check
Free updates and new releases
MOST POPULAR
TMS VCL Subscription
€ 895
€
450
for a 2 year renewal
license for 1 developer
Includes
check
Full source code
check
Access to the TMS Support Center
check
Free updates and new releases
check
TMS VCL Chart
check
All TMS VCL products
more_horiz
Discover more
BEST VALUE
TMS ALL-ACCESS
€ 1,795
€
595
yearly renewal
license for 1 developer
Includes
check
Full source code
check
Access to the TMS Support Center
check
Free updates and new releases
check
TMS VCL Chart
check
All TMS VCL products
check
All TMS products
more_horiz
Discover more
All prices excl. VAT. Renewal price is subject to change and only valid up to 30 days after license has expired. After renewal period a discount price is offered to renew the license.