TAdvStringGrid
Example 75 : Automatically connect TAdvStringGrid to TAdvChartView with TAdvChartLink
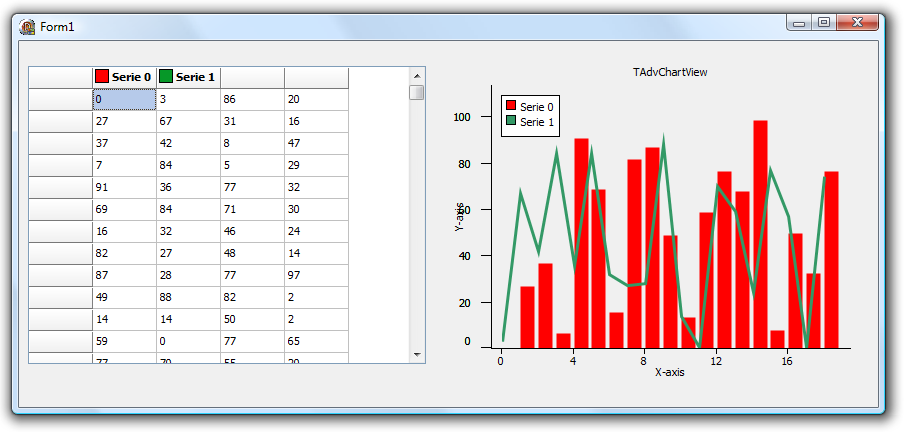 In many cases the data that should be visualized in a chart is already available in a grid. Typically, it is also desirable that a chart automatically updates when the values in the grid change. To assist in this frequently occuring scenario, we have created the component TAdvChartLink that is a bridge between data in the grid and data in series of the TMS TAdvChartView. TAdvChartLink connects to a grid (TAdvStringGrid, TDBAdvGrid, TAdvSpreadGrid, TAdvColumnGrid) and a chartview TAdvChartView or TAdvGDIPChartView. Data in a specified range of cells can be connected to any serie in any pane of the chartview.
Steps to get started:
- 1) drop a TAdvStringGrid (or descendent class) on the form
- 2) drop a TAdvChartView (or descendent class) on the form
- 3) drop one or more TAdvChartLink components on the form
- 4) assign the grid to TAdvChartLink.Grid and the chartview to TAdvChartLink.ChartView
- 5) Configure the chartview to have the number of series and serie properties that you want to display
The data is specified via TAdvChartLink.GridValues:
DataTypes:
dtNormalColumn : data comes from normal cells (not fixed cells) in a column specified by Column
dtFullColumn : data comes from all cells (normal & fixed cells) in a column specified by Column
dtNormalRow : data comes from normal cells (not fixed cells) in a row specified by Row
dtFullRow : data comes from all cells (normal & fixed cells) in a row specified by Row
dtNodeLevel : data comes from normal cells (not fixed cells) in a column specified by Column only for rows that have a node with level set by NodeLevel
dtCellRange : data comes from cells specified by Left/Right Top/Bottom coordinates
As soon as TAdvChartLink.Active is set true, the specified data of the grid will be synchronized with the chart serie. When the grid values are updated via editing, the serie in the chart will also be automatically updated. When changing the grid programmatically, call TAdvChartLink.Synchronize to programmatically force an update.
Property settings of TAdvChartLink:
Active: Setting this property to true starts synchronizing the data in the chart with the data from the grid
AutoRange: Sets the type of Y-axis auto-ranging
ChartType: Sets the type of the chart serie to use for the selected grid data
ChartView: Sets the TAdvChartView component to use for synchronizing data
Grid: Sets the grid component to use for synchronizing data
GridValues: Property that holds the settings that define what data of the grid is synchronized to a chart
- Bottom: Sets the bottom row for dtCellRange type
- Column: Sets the column to synchronize for dtNormalColumn, dtFullColumn type
- DataType: Selects what type of range of data in the grid to synchronize
- dtNormalColumn: a column of normal cells. Column is set with GridValues.Column
- dtFullColumn: a column of fixed & normal cells. Column is set with GridValues.Column
- dtNormalRow: a row of normal cells. Row is set with GridValues.Row
- dtFullRow: a row of fixed & normal cells. Row is set with GridValues.Row
- dtCellRange: a range of cells. The range is set with GridValues.Left,GridValues.Right and GridValues.Top, GridValues.Bottom
- dtNone: No grid data range is used
- dtNode: Same as dtNormalColumn except that only rows with a node are synchronized
- LegendText: Sets the legend text for the serie synchronized with the grid
- LegendTextType: Sets where to retrieve the serie legend text from
- NodeLevel: Sets the level of the node to use for dtNode datatype
- Right: Sets the right column for dtCellRange type
- Row: Sets the row to synchronize for dtNormalRow, dtFullRow type
- XAxisColumn: Sets the column where X-axis values are set
- XAxisRow: Sets the row where X-axis values for the serie are set
- XAxisType: Sets if and where X-axis values of the serie should be retrieved from the grid
PaneIndex: Sets the index of the pane in the chart in which the serie is located that will receive the grid data
SerieIndex: Sets the index of the serie in the chart data will receive the grid data
Delphi project & source files for downloading included in the main demos distribution for Delphi.
×
![]()