Frequently Asked Component Specific Questions
Options |
|
Display all FAQ items |
Displaying items 1 to 1 of 1, page 1 of 1
<< previous next >>

 TMS FMX Chart
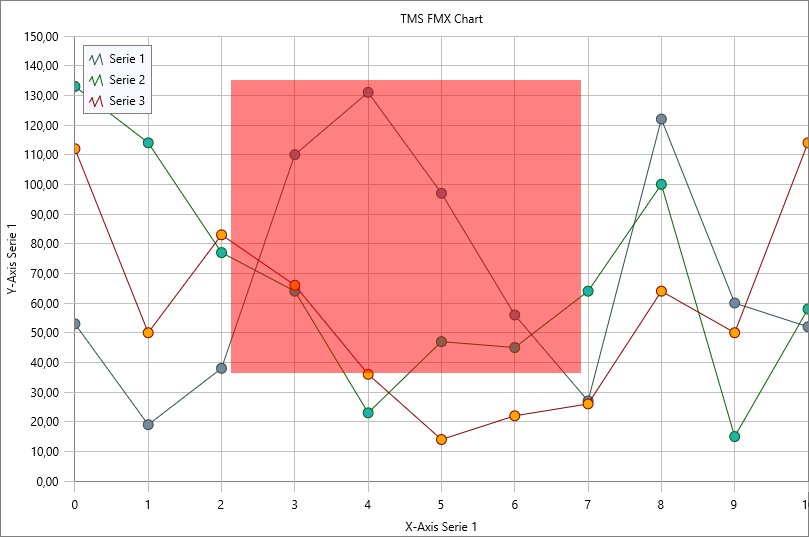
Zooming
The zooming functionality like in the VCL version is not implemented yet. We will add this on our feature request list, but as a starting point we have included a sample that allows you to write an own implementation. To test this code below after implementation, hold the CTRL key on the keyboard, click on the chart and drag down/right to zoom in to a specific area.
private
    { Private declarations }
    FDragArea: Boolean;
    FDragDownPos, FDragMovePos: TPointF;

....

procedure TForm1.FormCreate(Sender: TObject);
begin
  TMSFMXChart1.InteractionOptions.ScaleMode := smNone;
end;

procedure TForm1.TMSFMXChart1AfterDrawChart(Sender: TObject; ACanvas: TCanvas; ARect: TRectF);
begin
  if FDragArea then
  begin
    ACanvas.Fill.Color := claRed;
    ACanvas.FillRect(RectF(FDragDownPos.X, FDragDownPos.Y, FDragMovePos.X, FDragMovePos.Y), 0, 0, AllCorners, 0.5);
  end;
end;

procedure TForm1.TMSFMXChart1MouseDown(Sender: TObject; Button: TMouseButton; Shift: TShiftState; X, Y: Single);
begin
  FDragArea := (ssCtrl in Shift);
  FDragDownPos := PointF(X, Y);
end;

procedure TForm1.TMSFMXChart1MouseMove(Sender: TObject; Shift: TShiftState; X, Y: Single);
begin
  if FDragArea then
  begin
    FDragMovePos := PointF(X, Y);
    TMSFMXChart1.Repaint;
  end;
end;

procedure TForm1.TMSFMXChart1MouseUp(Sender: TObject; Button: TMouseButton; Shift: TShiftState; X, Y: Single);
var
  I: Integer;
begin
  if FDragArea then
  begin
    for I := 0 to TMSFMXChart1.Series.Count - 1 do
    begin
      TMSFMXChart1.Series[I].AutoXRange := arDisabled;
      TMSFMXChart1.Series[I].AutoYRange := arDisabled;
      TMSFMXChart1.Series[I].MinX := TMSFMXChart1.Series[I].XToValue(FDragDownPos.X);
      TMSFMXChart1.Series[I].MaxX := TMSFMXChart1.Series[I].XToValue(X);
      TMSFMXChart1.Series[I].MinY := TMSFMXChart1.Series[I].YToValue(Y);
      TMSFMXChart1.Series[I].MaxY := TMSFMXChart1.Series[I].YToValue(FDragDownPos.Y);
    end;

    FDragArea := False;
  end;
end;