Blog
All Blog Posts | Next Post | Previous Post

 Video: Add Google Charts based on a database query to web applications in Delphi Rio (1/3)
Tuesday, April 30, 2019

The next videos of the School Data Series tackle the visualization of numbers using Google Charts.
Due to the amount of detail, I decided to split this topic into 3 separate videos.
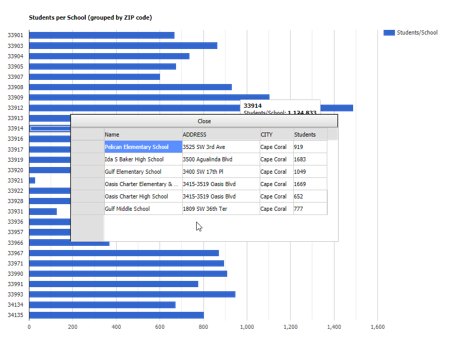
The end result will look like this:

Student numbers will be grouped by zip code. Users are able to click on the bars and drill-down all the schools in that area (master-detail).
The first video covers:
- Looking at the database
- Build the database query for the chart
- Convert database query into URL
- Add service method to XData web service for charting
The next video will show you how to build the web application that consumes the data. Finally, the last video adds the user-interaction with the popup-window. Look out for these parts, they will be published soon.
The first video is available here:
Holger Flick

This blog post has not received any comments yet.
All Blog Posts | Next Post | Previous Post