IW
TMS IntraWeb Charts
Fast multipane financial graphs & 2D feature rich charting
Also available for:
Tips and Frequently Asked Questions

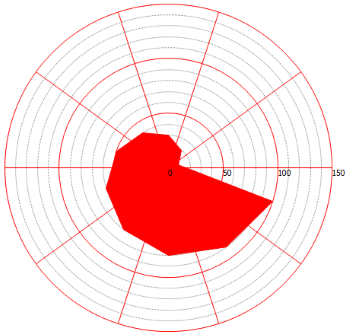
 How to configure the y-axis and y-grid of a spider chart
Simply drop a chart on the form and set the code in the formcreate. The y-axis and y-grid are configured to display every 20 units.
Sample code:
var
  s: TChartSerie;
  p: TChartPane;
  I: Integer;
begin
  AdvGDIPChartView1.BeginUpdate;
  AdvGDIPChartView1.Panes.Clear;
  p := AdvGDIPChartView1.Panes.Add;
  p.YAxis.AutoUnits := False;
  p.YGrid.AutoUnits := False;
  s := p.Series.Add;
  s.ChartType := ctSpider;
  s.Pie.Size := 300;
  s.YAxis.AutoUnits := False;

  s.YAxis.MajorUnit := 50;
  s.YAxis.MinorUnit := 10;

  p.YGrid.MinorDistance := 10;
  p.YGrid.MajorDistance := 50;

  p.YGrid.MajorLineColor := clRed;

  for I := 0 to 9 do
  begin
    s.AddSinglePoint((I + 1) * 10);
  end;

  AdvGDIPChartView1.EndUpdate;

Compatibility
- Delphi 7, 2007, 2010, 2009, XE, XE2, XE3, XE4, XE5, XE6, XE7, XE8, 10 Seattle, 10.1 Berlin, 10.2 Tokyo, 10.3 Rio, 10.4 Sydney, 11 Alexandria, C++Builder 2007, 2009, 2010, XE, XE2, XE3, XE4, XE5, XE6, XE7, XE8, 10 Seattle, 10.1 Berlin, 10.2 Tokyo, 10.3 Rio, 10.4 Sydney, 11 Alexandria, DXE15, CXE15 (Professional/Enterprise/Architect)
Licensing
- Licensing FAQ
- License for commercial use: Single developer license, Small team license, Site license
- Includes full source code
- Ask questions to our engineers related to purchased product via Support Center
- Free 1 year updates and new releases
- After 1 year, a discount renewal is offered for a 1 year extension. *
* offer valid for 30 days after end of license. Discount price is subject to change.