Good afternoon,
could be an "elementary" question.
How is possible avoid, in the chart, the horizontal scroll??
when i populate the serie with 1..31 x point with custom label (01/03/2020 ecc..), on the x value i have the first 31 points with the correct label, but after 31/03/2020 i have more blank point with label 32,33, 34 ..... seem infinite.
How i can enable the x scroll only from rigth to left and stop it when 31/03/2020 is reached and, finally, enable x scroll to left to rigth in order to return to start poin ?
Excuse me if this is not enough clear
Thank's
Regards
Daniele
1 Like
Solved ...
With Serie AutoXRange:=arEnabled and AutoYRange:=arEnabled the chart scrolling is enabled up to the x value is reached ... (Y value are setted by component ...)
Now i have more question ... but before do it .... i try to solve my need "playing" with your demo !!
Regards
Daniele
Hi to all again ...
there's some strange behavior with serie.AutoXRange.
From manual, if it is setted to false the min max values are setted via MinX and MaxX.
This mean if i set AutoXRange:=Disable, MinX:=1 and MaxX:=13 what i'm expected is, on X axis somthing like 1 ... 13.
What happend is, on X axis, chart start from 1 to 13 and .... more and more and more.
The chart scroll horizontaly (in any way from left to rigth and from rigth to left) without respect the limit (1..13); This means that on x axis, if i continue to scroll, go to + 200 or -200 (i'm topped on this value).
This happend in your demo UDemo (in fnc library), on Monthly Car sales with only "mercedes" series visible (in order to work only in one serie).
You can turn off scrolling/panning under Interaction:
TMSFNCChart1.Interaction.Panning := False;
Hi Pieter,
the matter is a little more complex.
I have, on android, a chart that montly increase it's x axis (from 1 to month days).
I have tryed several option but without result.
In this example i made test with 14 points and this is the results (none of them can reach my need).
First try i setted Serie.AutoXRange:=arEnabled; and i get this result
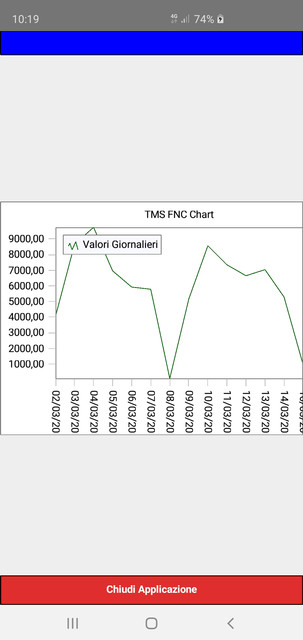
As you can see all the value are dispayed and the last one is not readable because is at the end of the scree.
So i disabled the Serie.AutoXRange and i get this

and
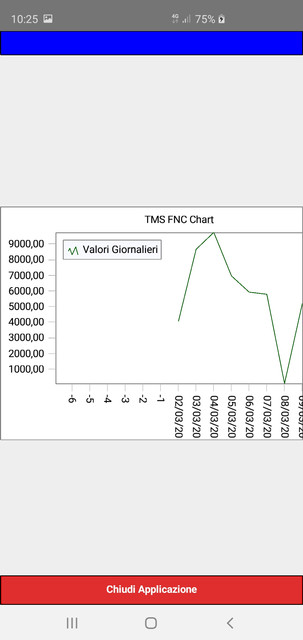
I have, on x axis, scroll enabled but the scroll is for infinite values.
I think that the scroll must work only with points number; i mean the autoxrange is disabled, the chart width is greater then device screen width, the scroll is enabled and it stop when last point is showed + offset pixels in order to show the last point value.
Due the fact that are not present negative points, the scroll from left to rigth is disabled.
Is very problaby that this result is already reachable .. but i'm not abale to do it.
Any help is welcomed ...
Thank's for attention
Regards
Daniele
What exactly is it that you want to achieve? Scrolling can be enabled or disabled manually so if you add / specify dates you can turn off the scrolling yourself. If you are using numbers, turn on scrolling with the property mentioned earlier. If you want to visualize the last point without enabling scrolling you need to take a look at the following properties:
MinXOffsetPercentage
MaxXOffsetPercentage
to allow a margin to be applied to the values in order to visualize them correctly while maintaining an auto scroll range.
Hi Pieter,
first of all thanks for reply and thanks for your patience !!
The result to achieve is in the middle.
I try to explain better (with my poor english).
X axis is date setted and it's populate day by day from1 to 31 (last day of the month).
I have 2 "scenario".
1 - from1 to 15 i can set autoxrange enable with x offest in order to show these values.
2 - from16 to 31 i must set autoxrange to disable in order to show these value over the device screen with.
In situation 1 i have no problem (thank's for offset suggestion), i have a fixed chart, all the x points values stays into device screen width and are good readable.
In situation 2 i heve a "cosmetic" problem.
If i set autoxrange to enable i have all the points in device width, are too close and the values are baddly readable.
So i set it to Disable and the points are well distribute on x axis .... but in this case the chart is scrollable (it's rigth) in booth ways (lefth to riigth and opposite) with numeric x value on axis over the inserted points . What i'm trying is stop scrolling when last point is visible and disabled lefth to rigth scroll (avoiding negative x axis value) in any allowed way.
Till now i tryed a lot of setting combination without success.
Sorry for any unclared matter.
Thank's for attention and help.
Regards
Daniele
OK, I think I understand now, you want to show a portion of the values and then allow shifting to the other values because showing all values with the arEnabled option is not working because of the close density of the values, which makes them unreadable. A possible solution for this would be to disable panning (under Interaction) and use buttons to navigate to the next date/previous date by incrementing / decrementing the MinX and MaxX values.
Hi Pieter,
to be honest i did not think to this solution.
Thank's for suggestion .... I'll do it.
If i can, my case could be a "non isolated case". Please consider (for a future release) to add a new value for autoxrange as, for example, arDisabledWithLimit; in this case the panning is allowed within MinX and MaxX.
Thank's again
Daniele
That is a very good suggestion!