Good afternoon to all,
i'm tring to convert the last non advchart in my project into TAdvGDIPChartView.
The first problem is that the chart is insert in very small area, and i can't move it.
The second problem is that the chart have 1 pane with 2 series, one fot current year and one for last year.
X axis is a "day line" and i need to display only the day number; Chart type does not rapresnt a problem.
All points are added with AddSinglePoint procedure.
The problem i have is how set the space from one day number and next.
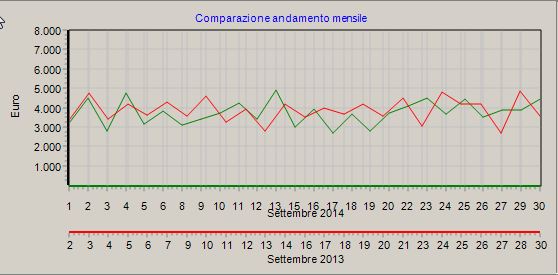
This is a old chart (real dimension)
and this is the trial chart conversion .... (the secon serie is missing at the moment); i'm tring with bar ....
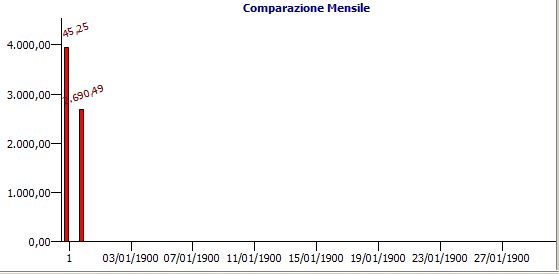
How is possible paint the string '1' in the middle of first bar??
The code i use to make test serie is
procedure TMF.ImpostaGrafico;
Var I : Integer;
begin
for I:=CHT1.Panes.Count - 1 downto 0 do
CHT1.Panes.Free;
CHT1.BeginUpdate;
// Aggiungo un nuovo panel
CHT1.Panes.Add;
CHT1.Panes[0].Range.RangeFrom:=0;
CHT1.Panes[0].Range.RangeTo:=31;
CHT1.Panes[0].CrossHair.CrossHairType:=chtFullSizeCrossHairAtCursor;
CHT1.Panes[0].CrossHair.CrossHairYValues.ShowSerieValues:=True;
CHT1.Panes[0].CrossHair.CrossHairYValues.Position:= CHT1.Panes[0].CrossHair.CrossHairYValues.Position + [chAtCursor];
CHT1.Panes[0].CrossHair.Visible:=False;
CHT1.Panes[0].Legend.Visible:=False;
CHT1.Panes[0].AxisMode:=amAxisChartWidthHeight;
CHT1.Panes[0].XAxis.UnitType:=utDay;
CHT1.Panes[0].XAxis.AutoSize:=False;
CHT1.Panes[0].YAxis.AutoSize:=True;
CHT1.Panes[0].Title.Text:='Comparazione Mensile ';
CHT1.Panes[0].Title.Font.Color:=clNavy;
CHT1.Panes[0].Title.Font.Style:=[fsBold];
CHT1.Panes[0].Title.Position:=tTop;
CHT1.Panes[0].Title.Alignment:=taCenter;
// Aggiungo una nuova serie Anno Precedente
CHT1.Panes[0].Series.Add;
CHT1.Panes[0].Series.BarChartSpacing:=5;
//CHT1.Panes[0].Series.BarChartSpacingType:=wtPixels;
CHT1.Panes[0].Series[0].CrossHairYValue.Color:=clRed;
CHT1.Panes[0].Series[0].CrossHairYValue.Font.Color:=clYellow;
CHT1.Panes[0].Series[0].ShowValue:=True;
CHT1.Panes[0].Series[0].ValueAngle:=20;
CHT1.Panes[0].Series[0].ValueFormat:='#,###,##0.#0';
CHT1.Panes[0].Series[0].ValueFormatType:=vftFloat;
CHT1.Panes[0].Series[0].ValueFont.Color:=clMaroon;
CHT1.Panes[0].Series[0].ChartType:=ctBar;
CHT1.Panes[0].Series[0].AutoRange:=arCommonZeroBased;
CHT1.Panes[0].Series[0].RangePercentMargin := 15;
CHT1.Panes[0].Series[0].XAxis.XYValues:=False;
CHT1.Panes[0].Series[0].YAxis.AutoUnits:=True;
// CHT1.Panes[0].Series[0].Enable3D:=True;
CHT1.Panes[0].Series[0].Minimum:=0;
CHT1.Panes[0].Series[0].Maximum:=120000;
CHT1.Panes[0].Series[0].AddSinglePoint(3945.25,Date,clRed,True,'1');
CHT1.Panes[0].Series[0].AddSinglePoint(2690.49,Date,clRed,True,'2');
CHT1.EndUpdate;
end;
Thank's for your help
Regard
Daniele
Hi,
Hi Pieter,
thank's for your reply.
As first step i need to reproduce this
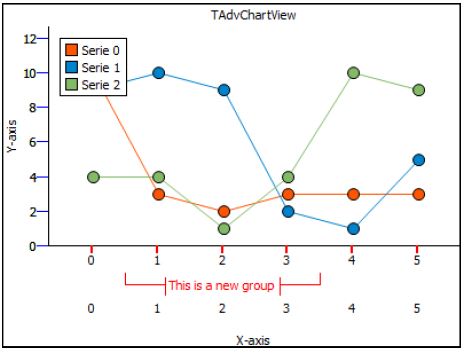
"This" meaning two series with different X value (grpouping as well to be used as "label") showed on two lines ....
but i'm not able ... sorry ...
Thank's for any help you can give me !!!
Regard
Daniele
you can disable the X-Axis for each series with Series[0].XAxis.Visible := False;
Hi Pieter,
yes with Series[0].XAxis.Visible := False; i can show or not the serie's x axis ....
But i found this (simple code)
CHT1.BeginUpdate;
// Aggiungo un nuovo pane
CHT1.Panes.Add;
CHT1.Panes[0].XAxis.UnitType:=utDay;
CHT1.Panes[0].Range.RangeFrom:=0;
CHT1.Panes[0].Range.RangeTo:=30;
// CHT1.Panes[0].XAxis.AutoSize:=False; << -- UNCOMMENT
// Just to draw a bar on chart
CHT1.Panes[0].Series[0].Minimum:=0;
CHT1.Panes[0].Series[0].Maximum:=120000;
CHT1.Panes[0].Series[0].ChartType:=ctBar;
CHT1.Panes[0].Series[0].AddSinglePoint(3945.25,Date,clRed,True,'1');
// Aggiungo una serie
CHT1.Panes[0].Series.Add;
// Aggiungo una serie
CHT1.Panes[0].Series.Add;
// Aggiorno il grafico
CHT1.EndUpdate;
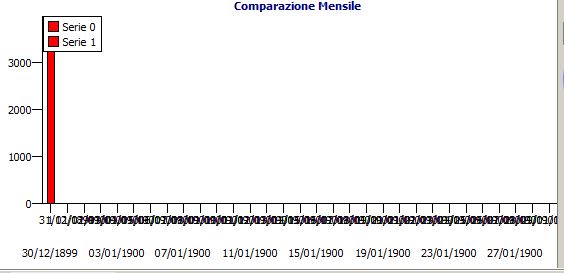
With this code a blank chart is drowed with 2 series and 2 x axisis, all with default setting.
Now if run the same code but with signed line uncomment, the second x axis will be hide.
Why?? I need more then 1 x axis with no autosize.
So i leave CHT1.Panes[0].XAxis.AutoSize:=True and
CHT1.Panes[0].Series[0].XAxis.AutoUnits:=False;
In this case all 31 x point are drowed on x axis with it's own value; like
but i need the second x axis blank and the first one with only 1 value (under the bar)
Thank's for reply
Regard
Daniele
Hi,
Hi,