Hello
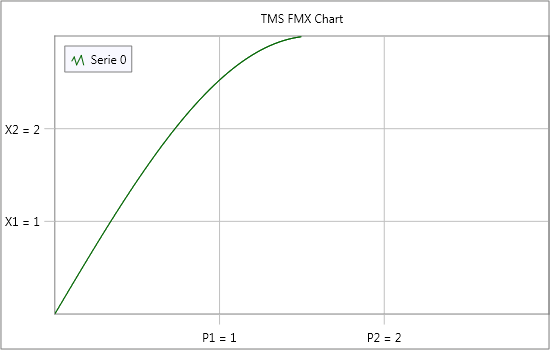
I have a bit difficult task. I want to create a chart with one line series and 2 vertical and 2 horizontal lines representing limit values. I want those lines to have name texts on representing axis (as shown in picture). Also could it be done to not show any values of x or y axis accept where those limit vales are. I know it's a bit hard question but i only want to know if it's possible, and what methode should i use to achive this. I use AdvChart in some project but usualy with standard funtions.
Delphi XE5 AdvChart
Hi,
We have investigated this here, but the AdvChartView is too limited in terms of customization / custom drawing to achieve the result in the screenshot. We do however have an alternative solution in FireMonkey that allows more customization. By implementing the appriopriate events for customizing the X-Axis / Y-Axis and X-Grid / Y-Grid we were able to achieve the following result (don't mind the actual data represented by the green line as this was only for demonstration purposes):
Kind Regards,
Pieter
Pieter Scheldeman2014-06-20 10:13:26