Hi,
Thanks to Pieter I have the real-time chart working. I just have a couple of more things I need advice on as I couldn't find anything in the manual.
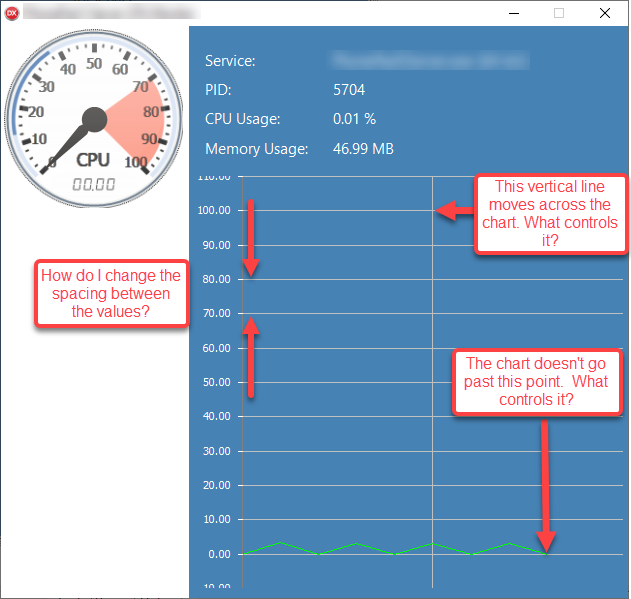
Please see attached image.
Thanks.
= Steve
The vertical line is a grid line which is configured with the XGrid property. The values spacing at the left side can be configured with the MajorUnit / MinorUnit properties at YValues property. The chart x-range should be automatically configured but can be configured with the MinX, MaxX properties at XValues level. More information can be found in the manual:
Your welcome.