Tips and Frequently Asked Questions

 Visual organisation of TMS Advanced Charts


TAdvChartView consists of multipane charts. This means that the chartview can have one or more panes and each pane can display a chart with a single or multiple series. The charts on the panes can scroll and zoom synchronously or can also do this independent of each other. The panes of the chartview are accessible through the component‘s Pane collection. The major elements of the chart are indicated on this screenshot:
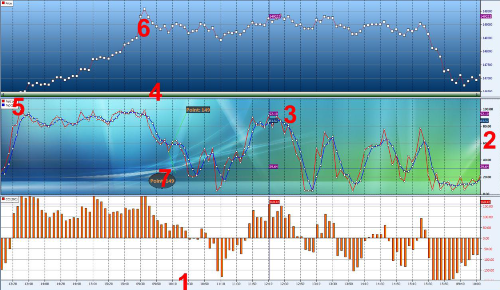
1: X–axis:
Displays the range of points in the chart in number format, a date/time format with unit types minute, day, month, year, custom drawn values or specified values per point. The X-axis supports scaling with mouse. Include poHorizontalScaling in Pane.Options property, then click and drag mouse left or right to see more or less points.

2: Y–axis:
Displays the range of series values from a defined minimum to maximum or via Autorange the best range can automatically be choosen. The Y-axis supports scaling with the mouse and/or keyboard. Include poVerticalScaling in Pane.Options property, then click and drag mouse up or down or press Shift Up/Down to expand or reduce the maximum and minimum value. The Y-axis can be set at the left side of the chart, the right side of the chart or both sides. Different Y-axis values can be shown for different series. The Y-axis also has the capability to show major & minor units with a different font.

3: Crosshairs:
When crosshairs are enabled, move the mouse in the pane area and values which intersect with the crosshair are shown either in the Y-axis area, at the crosshair intersection point, in a separate tracker window or the values can be programmatically retrieved to display in another control.

4: Navigator:
Enable the navigator to scroll left or right in the chart pane. The navigator also offers the same capability as the X–axis itself to zoom in/out.

5: Legend:
Displays the legend text for the number of current chart series added to the chart pane.

6: ChartType:
Choose a chart type and add markers to mark the Y–value of the point.

7: Annotations:
Add an annotation to add text to important points in the serie.

When a New TAdvChartView component is dropped on the form, the component contains one pane with 3 series. Double-click the TAdvChartView component to popup the pane editor that allows adding and removing series from the pane.


Pricing

Single Developer License Small Team License Site License
 

TMS VCL Chart


€ 125

70 yearly renewal
license for 1 developer


Includes
check  Full source code
check  Access to the TMS Support Center
check  Free updates and new releases
MOST POPULAR

TMS Component Studio


€ 575

285 yearly renewal
license for 1 developer


Includes
check  Full source code
check  Access to the TMS Support Center
check  Free updates and new releases
check  TMS VCL Chart
check  All TMS VCL products
more_horiz  Discover more
BEST VALUE

TMS ALL-ACCESS


€ 1,795

575 yearly renewal
license for 1 developer


Includes
check  Full source code
check  Access to the TMS Support Center
check  Free updates and new releases
check  TMS VCL Chart
check  All TMS VCL products
check  All TMS products
more_horiz  Discover more
All prices excl. VAT. Renewal price is subject to change and only valid up to 30 days after license has expired. After renewal period a discount price is offered to renew the license.

TMS ALL-ACCESS

key
Get unlimited access to all TMS products
local_offer
One money and time saving bundle

Free Trial

Start a free TMS VCL Chart evaluation today!
RAD Studio

What our customers say

Finally, a chart control that hits the sweet spot! As a product, AdvChart has the right approach. It's still very simple to use, the price is perfect, the code is included and easy to modify to taste and things that would be hard to add later or by the user are already taken into account like multiple panes.

- Orlando Diaz

I have tried your new "TAdvGDIPChartView : GDI+ enabled multi-pane chart component" demo and I am extremely impressed. I develop applications using Borland Delphi 5 and for years now, the obvious choice for charting components has been TeeChart. Well not any more !!! I often find that charting components can be a bit clumsy and awkward to use, but your charting components' properties are extremely well laid out and easy to use. Also, when looking at the GDI plus demo, the quality of rendering and anti-aliasing is world-class. Other charting components out there advertise lovely, glossy and shiny charts on their web site, but when you run their demos it's a very different story indeed. They are often poorly rendered and produce dodgy anti-aliased drawings, they are over-priced, etc... So all in all, you certainly have the best charting component that I have ever came across - on the first release and for such a great price ! I was currently looking for a new charting component - well not any more ! I will be recommending that the company that I work for purchases your new charting component.

- Dave Scott

Another great TMSSoftware component! And very excellent support and help by the TMS software team.

- Marco Boglione

Thanks for a truly excellent IW component set, I am genuinely impressed. ... TMS Advanced Charts are just stunning !

- Pete Barrett via email

After using Tee Chart Pro and RiverCharts for many years it took me sometime to work through the differences with TMS Charts but - now I have worked through the learning curve the TMS Charts certainly deliver. Thanks for yet another great set of components.

- David Case

TMS WEB Core

language
Create modern web apps in Delphi & VSC
build_circle
Use Object Pascal code to build JavaScript apps