Blog Options
Archive
<< April 2024 >>-
Wednesday 17
- New free component for sophisticated file uploads with TMS WEB Core -
Tuesday 16
- Closing the gap with TMS FNC UI Pack new additions -
Thursday 11
- Unveiling the Latest Enhancements in TMS VCL UI Pack -
Friday 5
- TMS components and Delphi and C++Builder 12.1 -
Wednesday 3
- Customizing the login page of your application using TMS Sphinx
- A Python library for using StellarDS.io effortlessly
- Introducing: How it Works with Holger - Building a Pexels gallery app with TMS WEB Core video series
- TMS FNC Cloud Pack with StellarDS.io backend: unparalleled productivity in VCL & FMX
Authors
- Bernard Roussely (1)
- Wagner Landgraf (82)
- Roman Yankovsky (2)
- Bart Holvoet (27)
- Aaron Decramer (17)
- Pieter Scheldeman (99)
- Nancy Lescouhier (32)
- Adrian Gallero (33)
- Bruno Fierens (403)
- Marcos Douglas B. Santos (5)
- Wagner R. Landgraf (1)
- Bradley Velghe (16)
- Bernard (2)
- Andrew Simard (86)
- Holger Flick (15)
- Gjalt Vanhouwaert (30)
- Tunde Keller (22)
- Masiha Zemarai (119)
Blog
All Blog Posts | Next Post | Previous Post

 How to extract information from Google Analytics using Analytics API and FlexCel.NET
Bookmarks:
Friday, May 1, 2009
In my last post I mentioned that I needed some data that I couldn't get directly from Google Analytics, so I had to find my way. In this post I am going a little deeper on how I did it. Note that this is going to be kind of technical, and I assume that you have an idea on how to use FlexCel, so if you are just interested in the application, you can scroll to the bottom where the actual code an executables are.My problem was that I could get the browser share in a given month, but not the evolution over a period. And I could have gone month by month, taking each month data and pasting it in an Excel sheet, if it wasn't because that is a job for computers, not for humans.
Knowing that Google had just released an API to access Analytics with code I did what every reasonable man would do: I wrote my own application to extract the data and chart it automatically. That took me only about 5 hours; while copying and pasting month by month directly form the web application would have taken me more like 5 minutes. Five minutes of boredom and doing a repetitive task against 5 hours of fun and learning, I know what I choose. And as a bonus, I have an application I can share with you.
Accessing Google Analytics
The first part of the plan was to get the Data from Analytics. This turned out to be relatively easy and without issues, even when Google doesn't support at this time C# classes to encapsulate the access.There are 3 steps in accessing data from Analytics:
- 1) Authenticate the user: To do this you just do an HTTP POST to an URL with the login data. Google will return you an ID that you need to use in all subsequent calls to the API.
- 2) Get the Profiles available for the user: A user might have more than one website linked to his account, so before asking for any data, you need to know which account you are speaking about. This is done with and HTTP GET to the server, where you pass as parameter the ID you got in 1) and get as result a list of the profiles.
- 3) Get the data for a given Profile: This is other simple GET to the server, where you pass the ID in 1) and the profile in 2), along with the variables you want to analyze, and get back the values of the variables.
The three steps were encapsulated into three methods in one class, AnalyticsAPI in AnalyticsAPI.cs that is included in the sources attached to this post. There are more details in the sources, but all in all, it is straightforward to use.
Creating the charts
Once I had the data, my next concern was to create the reports in a way that was extensible. Put it in other words, I don't want to recompile the application each time I add or modify a report.
To achieve that, first thing I did was to load the reports at startup from a "templates" folder and add them dynamically to a combo box. So, to add a new report, you just create an xls file in the "templates" folder, and it will automagically appear next time you open the application.
Next, I had to define a data layer that could be changed directly form the template, and "User Tables" in FlexCel were a perfect match here. I just needed to create an event for a user table where you will pass the parameters you want to chart from the template, and this event would load a datatable with the needed data from the Google Analytics service, to return it back to FlexCel.
The one thing that took me most of the time in the full application design was to decide what data to return in this user table. I wanted to create mainly cross reference reports, so the natural idea would have been to return 2 tables like this:
Data
| Start Date | End Date | First Dimension Record | Second Dimension Record | ... | Last Dimension Record |
| First Period Start Date | First Period End Date | First Metric record for first dimension | First Metric record for second dimension | ... | First Metric record for last dimension |
| ... | ... | ... | ... | ... | ... |
| Last Period Start Date | Last Period End Date | Last Metric record for first dimension | Last Metric record for second dimension | ... | Last Metric record for last dimension |
Dimension names
| Caption |
| First Dimension Name |
| ... |
| Last Dimension Name |
So, if for example my dimensions were "Browsers" and my metrics "Percent of views", I would get the following tables:
Data
| Start Date | End Date | Firefox | Internet Explorer | Opera | Chrome | Safari |
| 2008-04-29 | 2008-05-29 | 38% | 53% | 7% | 1% | |
| 2008-05-30 | 2008-06-29 | 36% | 55% | 8% | 1% | |
| 2008-06-30 | 2008-07-29 | 41% | 51% | 7% | 1% | |
| 2008-07-30 | 2008-08-29 | 41% | 50% | 7% | 1% | |
| 2008-08-30 | 2008-09-29 | 38% | 48% | 8% | 4% | 1% |
| 2008-09-30 | 2008-10-29 | 41% | 46% | 8% | 4% | 1% |
| 2008-10-30 | 2008-11-29 | 40% | 47% | 8% | 4% | 1% |
| 2008-11-30 | 2008-12-29 | 40% | 46% | 8% | 4% | 1% |
| 2008-12-30 | 2009-01-29 | 41% | 44% | 9% | 5% | 1% |
| 2009-01-30 | 2009-02-28 | 43% | 43% | 8% | 4% | 1% |
| 2009-03-01 | 2009-03-29 | 43% | 42% | 8% | 5% | 1% |
| 2009-03-30 | 2009-04-29 | 43% | 42% | 7% | 5% | 2% |
Dimension names
| Caption |
| Firefox |
| Internet Explorer |
| Opera |
| Chrome |
| Safari |
Creating the cross references like this would make it trivial to dump in a report and would probably be the way to go if we wanted to do only cross reference reports. But, as explained at the beginning I wanted to make this as extensible as possible, so I couldn't manipulate the data too much at the code, or I would need to change the code when a new kind of report came up. So I wanted "simpler" tables, and I would do the cross referencing directly at the template, even if it was a little more work.
So finally the User Table is just a collection of key-values: for each period a list of a dimension and its corresponding metric.
Data
| Period Id | Dimension | Metric |
| First Period Id | First Dimension record | Metric for First Dimension |
| ... | ... | ... |
| Last Period Id | Last Dimension record | Metric for Last Dimension |
Replacing this with real values, this is what we would get:
Data
| Period Id | Dimension | Metric |
| 1 | Firefox | 38% |
| 1 | Internet Explorer | 53% |
| ... | ... | ... |
| 12 | Safari | 2% |
Besides this user table, we provide a global table with the periods, to use as a master in master detail reports, or as the lookup source in cross references:
Period
| PeriodId | StartDate | EndDate |
| 1 | Start date for period 1 | End date for period 1 |
| ... | ... | ... |
| n | Start date for period n | End date for period n |
Getting the data from here is not as straightforward as getting it from the former data model, but it allows us to do other kind of reports besides cross references. And with the help of the <#lookup> tag and vertical ranges, creating the right template for a cross reference isn't so complex either, as you can see in the attached examples.
Dealing with multiple periods
The full point of this application was to automatically retrieve data from more than one period from Analytics, as neither the web interface nor the API provide a way to do this. So, we have to make multiple calls to the API, once for each period we want to get information for.There is a small catch here. Let's imagine we want to get the top 2 browsers in the last 3 months, aggregated by month. So we would ask Analytics for the 2 top browsers last month, then the 2 top browsers last month - 1, and so on, to later add all of this data in a single dataset and return that for charting. But, if you are not sleeping yet, you might have noticed something is wrong. And if you didn't, let's try with some sample data. Imagine this are the results we get from our query:
| PeriodId | Browser | Share |
| 1 | Netscape | 21% |
| 1 | IE | 30% |
| 2 | Firefox | 25% |
| 2 | IE | 28% |
| 3 | Firefox | 27% |
| 3 | IE | 11% |
The problem here is that in the first period "Netscape" was in the second position, so Analytics is not returning us any data for Firefox. But market share for Firefox wasn't 0 in the first period, it just was in the third position, and as we are asking for "Top 2", Analytics didn't return any data for it.
It would be too complex to fix this in a 5 hour project, but FlexAnalytics does provide a workaround. What it does is to return the "top n" dimensions for the last period, and "top m" for the others. You specify the values of "n" and "m" in the Excel template. So, if you specify say "n=2" and "m=5", you will get 2 values for the last period (that you can use to create the table) and then 5 results for all the others. It is very likely that Firefox will be among the top 5 even if it is not in the top 2, and you will get its data. Of course this is not 100% foolproof, but good enough.
Note: Having more results in older periods is ok for cross reference reports, since you are doing a lookup in the table anyway, so extra results won't matter. But if doing a normal "master detail" report, you need to set "n = m" in order to have the same number of records in all periods.
Using the Application
To round up this post, I will explain how the compiled application works. When using it, always keep in mind that this was done completely in 5 hours, so don't expect miracles of usability. And yes, I know the buttons are too big.Once you run the exe file, you will see a box where to enter your Analytics user and password. If the credentials are ok, you will get to the following screen:
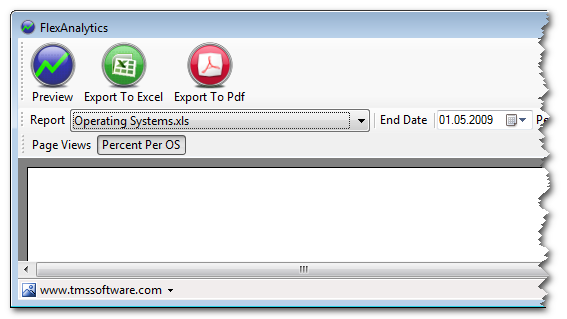
The first 3 buttons are kind of self explanatory, they will preview the report in site, export it to Excel, or to PDF.
After that there is a combo box where you can choose the report you want to run. The reports in the combo are the names of the xls files in the folder "<folder where the exe is>\templates". I included the 4 templates I used here, but you can add your own. To the right, you can choose an end date for the report, and how much periods of time you want the report to go back.
Below there is a bar with the sheets in the Excel template, and at the bottom, there is a status bar where you can select which of the Google Analytics profiles associated to your account to use.
As you can see it is quite simple to use. Adding new reports is a little more complex, since you will need to know how to create FlexCel Reports, but if you do, then you can customize the hell out of this, create your own reports, whatever.
Download the files
Source Files You will need Visual Studio 2008 and FlexCel.NET to compile it.Compiled application Includes a trial version of FlexCel.dll, if you are a registered user just replace it with your own. Requires .NET 3.5
One last thing
As you would expect, there are not any restrictions in any way to use the source code in this small application for whatever you want and don't want. This is just demo code, so feel free to modify it, mutilate it, improve it, destroy it or add it to your own applications. And if you do decide to create your own templates for the application and would like to share them just send them to me. I will make sure to add a link to them in this article next to the download links.Adrian Gallero
Bookmarks:

This blog post has not received any comments yet.
All Blog Posts | Next Post | Previous Post