Tips and Frequently Asked Questions

 How to configure the y-axis and y-grid of a spider chart
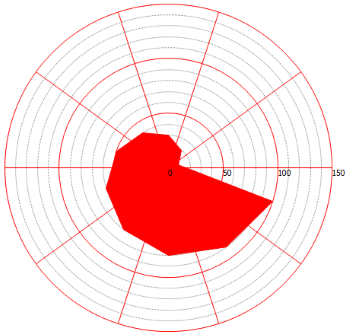
Simply drop a chart on the form and set the code in the formcreate. The y-axis and y-grid are configured to display every 20 units.
Sample code:
var
  s: TChartSerie;
  p: TChartPane;
  I: Integer;
begin
  AdvGDIPChartView1.BeginUpdate;
  AdvGDIPChartView1.Panes.Clear;
  p := AdvGDIPChartView1.Panes.Add;
  p.YAxis.AutoUnits := False;
  p.YGrid.AutoUnits := False;
  s := p.Series.Add;
  s.ChartType := ctSpider;
  s.Pie.Size := 300;
  s.YAxis.AutoUnits := False;

  s.YAxis.MajorUnit := 50;
  s.YAxis.MinorUnit := 10;

  p.YGrid.MinorDistance := 10;
  p.YGrid.MajorDistance := 50;

  p.YGrid.MajorLineColor := clRed;

  for I := 0 to 9 do
  begin
    s.AddSinglePoint((I + 1) * 10);
  end;

  AdvGDIPChartView1.EndUpdate;
Pricing
Single Developer License
Small Team License
Site License
TMS VCL Chart
€ 125
€
70
yearly renewal
license for 1 developer
Includes
check
Full source code
check
Access to the TMS Support Center
check
Free updates and new releases
MOST POPULAR
TMS Component Studio
€ 575
€
285
yearly renewal
license for 1 developer
Includes
check
Full source code
check
Access to the TMS Support Center
check
Free updates and new releases
check
TMS VCL Chart
check
All TMS VCL products
more_horiz
Discover more
BEST VALUE
TMS ALL-ACCESS
€ 1,795
€
575
yearly renewal
license for 1 developer
Includes
check
Full source code
check
Access to the TMS Support Center
check
Free updates and new releases
check
TMS VCL Chart
check
All TMS VCL products
check
All TMS products
more_horiz
Discover more
All prices excl. VAT. Renewal price is subject to change and only valid up to 30 days after license has expired. After renewal period a discount price is offered to renew the license.